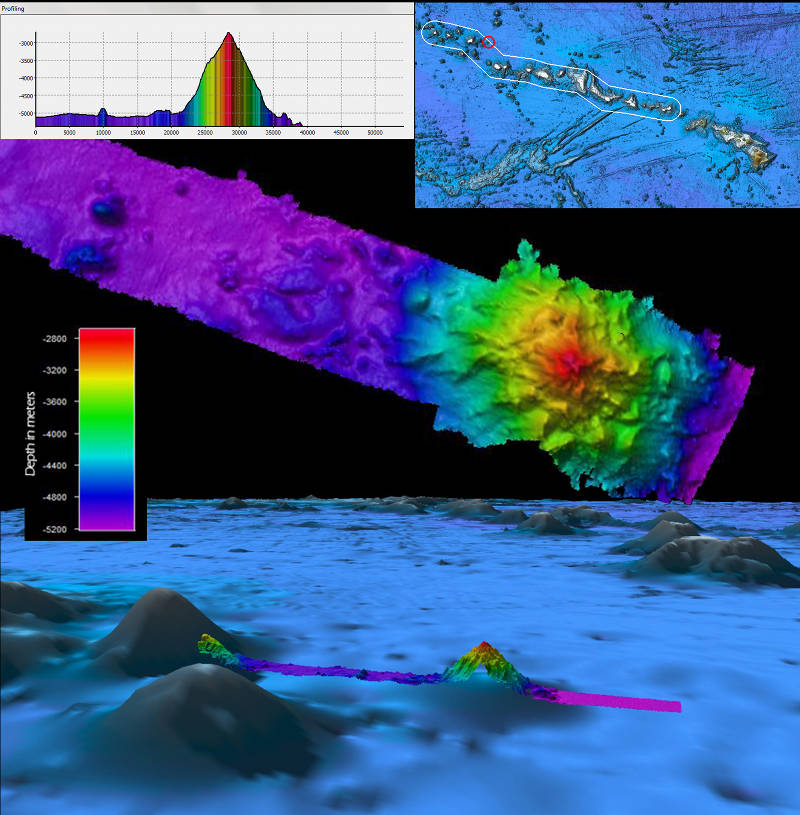
Composite image showing the original Sandwell & Smith satellite-derived bathymetry data at the bottom, with the Okeanos Explorer EM302 multibeam bathymetry transit data further revealing this unnamed seamount overlain on top. The middle image is a top-down view of the bathymetry data showing the seamount, and the graph in the upper left corner shows the vertical profile of the seamount’s height relative to the seafloor. The map on the upper right shows the bathymetry of the Hawaiian Archipelago with the Papahānaumokuākea Marine National Monument boundary in white, and the location of the seamount circled in red.
Previously Uncharted Seamount
Image courtesy of NOAA Ocean Exploration, 2015 Hohonu Moana. Download image (jpg, 1.4 MB).

Composite image showing the original Sandwell & Smith satellite-derived bathymetry data on the bottom, with the Okeanos Explorer EM302 multibeam bathymetry transit data further revealing this unnamed seamount overlain on top. The middle image is a top-down view of the bathymetry data showing the seamount, and the graph in the upper left corner shows the vertical profile of the seamount’s height relative to the seafloor. The map on the upper right shows the bathymetry of the Hawaiian Archipelago with the Papahānaumokuākea Marine National Monument boundary in white, and the location of the seamount circled in red.

Learn more