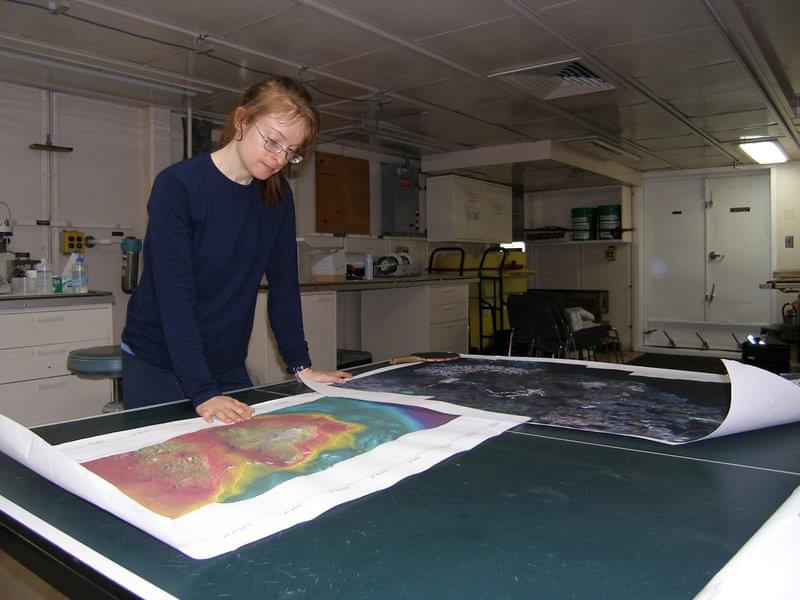
Bathymetric maps guide scientists as they explore the seafloor for coral and reef sites. Adding color to the maps provides visual cues. Later collection data and marker data can be added to the GIS information creating enriched visual information systems.
 Bathymetric Maps
Image courtesy of Lophelia II 2010 Expedition, NOAA-OER/BOEMRE. Download larger version (jpg, 2.7 MB).

Bathymetric maps guide scientists as they explore the seafloor for coral and reef sites. Adding color to the maps provides visual cues. Later collection data and marker data can be added to the GIS information creating enriched visual information systems.

Learn more