By Bran Black - Oregon State University, COAS
September 17, 2010
The first leg of this expedition has been dedicated to mapping the San Andreas Fault and surrounding seafloor via multibeam sonar. Multibeam sonar sends out a series of ‘pings’ to the sea floor and uses the time it takes from when the ‘pings’ were sent out to when their echo off the sea-floor returns to a sensor on the sonar to determine how deep the water is. Sonar can also indicate where ridges, rocks and other features of higher elevations are, as they will have a shorter return than the rest of the seafloor around them.
Oregon State University graduate students Morgan Erhardt and Bran Black deploy and recover a CTD off the back of the Derek M. Baylis. Data from the CTD is used to help calculate sound velocity in water, which is needed for multibeam data collection. Video courtesy of San Andreas Fault 2010 Expedition, NOAA-OER. Download (mp4, 12.1 MB).
The first leg of this expedition has been dedicated to mapping the San Andreas Fault and surrounding seafloor via multibeam sonar. Multibeam sonar sends out a series of ‘pings’ to the sea floor and uses the time it takes from when the ‘pings’ were sent out to when their echo off the sea-floor returns to a sensor on the sonar to determine how deep the water is. Sonar can also indicate where ridges, rocks and other features of higher elevations are, as they will have a shorter return than the rest of the seafloor around them.

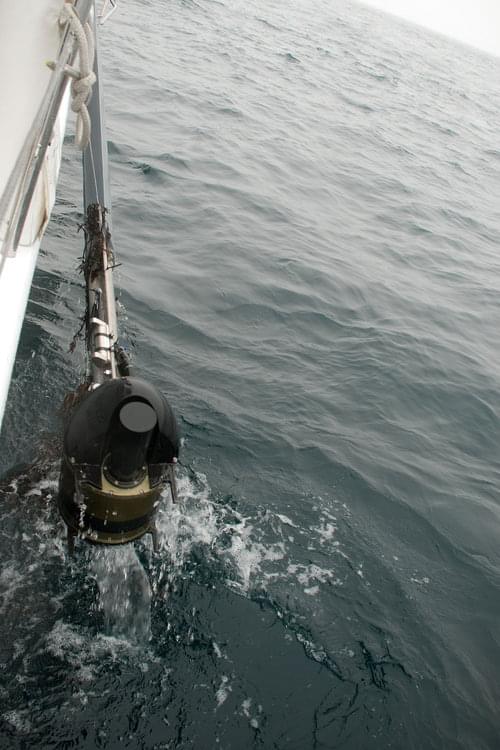
The multibeam sonar is taken out of the water for re-calibration at a specific time each day. Image courtesy of San Andreas Fault 2010 Expedition, NOAA-OER. Download image (jpg, 119 KB).
To process the multibeam data, periodic casts must be made with a CTD (Conductivity [salinity], Temperature and Depth) sampling device. This data will be used to calibrate sound velocity in water, which is needed in conjunction with the time it takes the ping to return to determine seafloor depth.

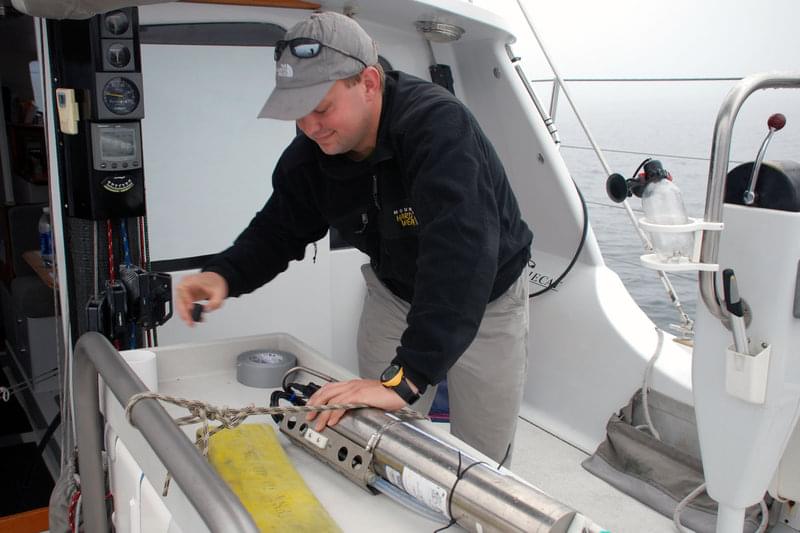
OSU Graduate Student Morgan Erhardt prepares the CTD for a cast. Image courtesy of San Andreas Fault 2010 Expedition, NOAA-OER. Download image (jpg, 114 KB).
Due to wave action and the movement of the ship, there are variations and outliers in data. To fix these, we enter the raw data into a computer program, such as Caris, and then edit out the outliers and abnormal returns to create a profile of the seafloor along the survey lines.
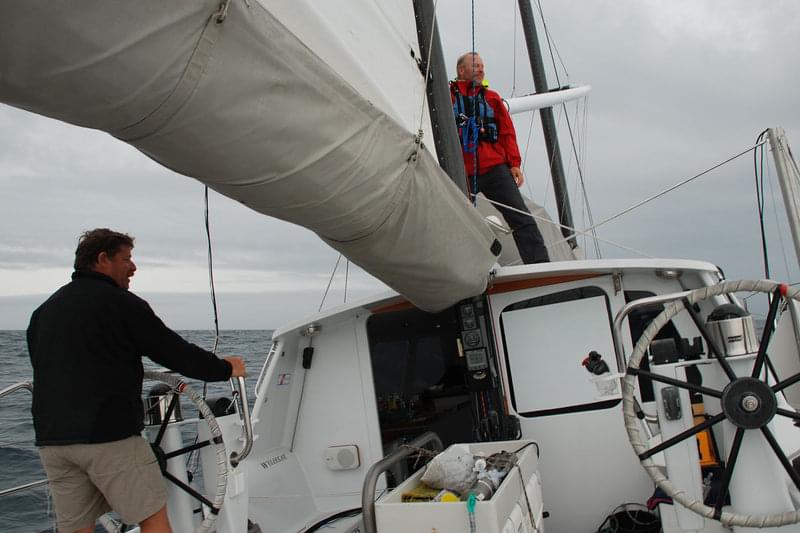
Multibeam surveys are run in a systematic patter, which is often referred to as “mowing the lawn.” Survey lines run parallel, with the ends overlapping to cover gaps in the data. To keep the boat on the correct survey line, members of the science crew keep a close watch on the heading and steer the boat either through a pulley system attached to the wheel, or at the wheel itself.

A screen shot of multibeam data processing using Caris software. This example is from the INDEX 2010 Expedition. Image courtesy of San Andreas Fault 2010 Expedition, NOAA-OER. Download image (jpg, 83 KB).

Project PI Chris Goldfinger keeps the Derek M. Baylis on track for another survey line. Image courtesy of San Andreas Fault 2010 Expedition, NOAA-OER. Download image (jpg, 113 KB).
Thus, through running a consistent survey and processing the multibeam data onsite, the research team is able to visualize where the San Andreas Fault is running under the sea and the surrounding seafloor terrain.