
By Waldo Wakefield - Research Fisheries Biologist - NOAA Northwest Fisheries Science Center
September 29, 2010
Dr. Waldo Wakefield from NOAA’s Northwest Fisheries Science Center explains how an echo-sounder is used to look for fish and other organisms in the water column. Video courtesy of Video courtesy of San Andreas Fault 2010 Expedition, NOAA-OER. Download (mp4, 36.5 MB).
The scientists involved in exploring the Northern San Andreas Fault are using a variety of sonic and optical imaging systems to visualize geology, geohabitats, and biological communities associated with the fault. From a bottom-up perspective, geophysical tools like the multibeam echosounder and seismic reflection “sparker” are being used to map high-resolution bathymetry and sub-seafloor layers or strata, respectively. Digital still cameras aboard the AUV Lucille are using advanced optical cameras to image surface features of the seabed and characterize habitats with their associated fauna. Above the seafloor, a multi-frequency quantitative sonar system is being used to image animals living in the water column—the “nekton” and “zooplankton”, especially aggregations of individuals such as fish schools, and those that often appear as layers comprised of smaller fishes, squid, and crustaceans such as shrimp and krill.

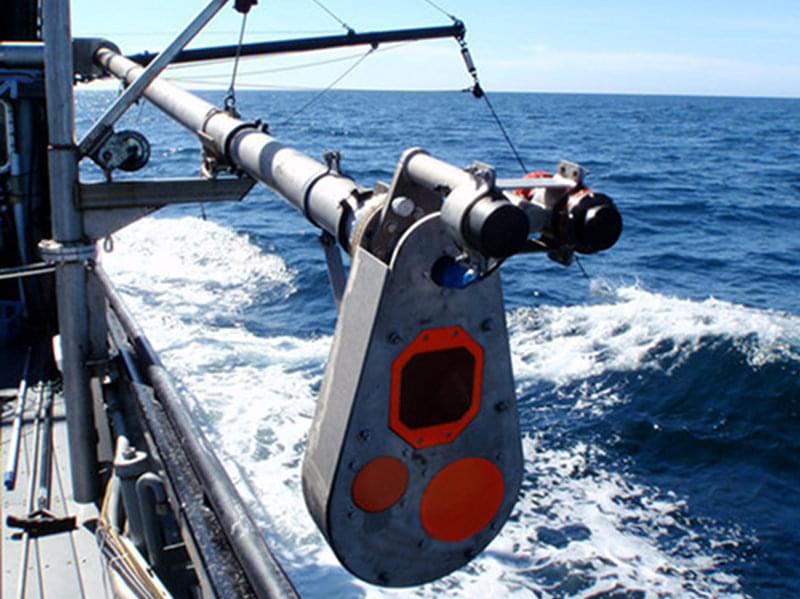
The acoustic sonar is used to image organisms living in the water column. Image courtesy of San Andreas Fault 2010 Expedition, NOAA-OER. Download image (jpg, 137 KB).
This computer screen capture shows an example of the output from the fisheries sonar system. Each of the three panels shows an echogram from a single frequency starting at the top with 38 kHz and moving through 70 and 120 kHz. A color scale is used to represent the strength of the sound returning from the seafloor and overlying aggregations of organisms. In each of the panels the seafloor shows a strong return as red at a depth of about 160 meters. During this portion of the survey the ship was passing over the San Andreas Fault which can be seen as a 10-meter offset at the center of the echogram. A sound scattering layer of smaller organisms, possibly krill, can be seen at a depth of about 100 meters most strongly in the 120 kHz echogram as blue, yellow and red traces. This layer is more or less absent in the lower 38 kHz echogram.

Data collected by the fisheries sonar system showing returns which may indicate aggregations of organisms inhabiting the water column. Image courtesy of San Andreas Fault 2010 Expedition, NOAA-OER. Download image (jpg, 158 KB).


