
By Chris Goldfinger - Marine Geologist/Geophysicist - Oregon State University, Marine Geology Active Tectonics Group,
Waldo Wakefield - Research Fisheries Biologist - NOAA Northwest Fisheries Science Center,
and M. Elizabeth Clarke - Research Fisheries Biologist - Northwest Fisheries Science Center
The Northern San Andreas Fault (NSAF) stretches from the Mendocino Triple Junction, an area in northern California where three tectonic plates meet, south through the San Francisco Bay area. The NSAF ruptured over 100 years ago in the great San Francisco earthquake of 1906. The rupture was thought to have caused rifts and scarps in the seafloor, but in the time that has passed since the earthquake, the underwater portion of the fault has remained largely unexplored until this past September when the expedition team completed a multidisciplinary investigation of the fault offshore of northern California. The expedition utilized two vessels, the Sailing Research Vessel Derek M. Baylis and the Research Vessel Pacific Storm as well as the SeaBED AUV Lucille from NOAA Fisheries Northwest and Pacific Fisheries Science Centers. Multibeam mapping operations and seismic profiling were conducted onboard the Baylis while AUV and fisheries sonar operations were conducted onboard the Pacific Storm.
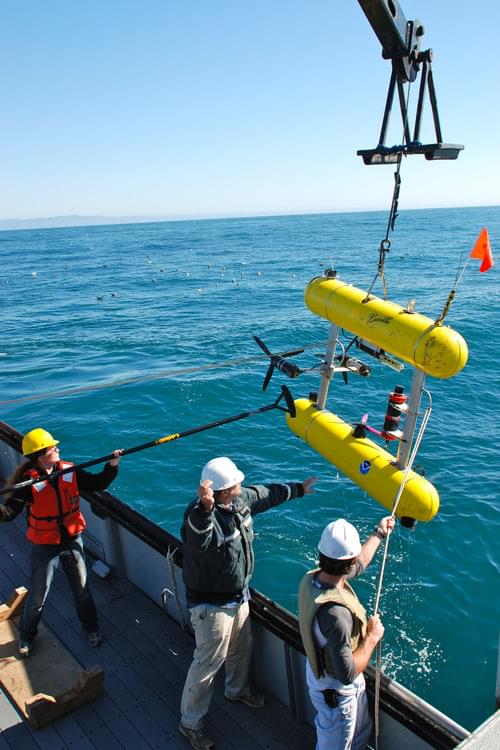
Jeremy Taylor from NOAA’s Pacific Islands Fisheries Science Center, NOAA Corps Officer Russell Haner and OSU graduate student, Bran Black, work together to deploy the AUV Lucille off the Pacific Storm. During the course of the mission AUV Lucille completed 14 missions, taking tens of thousands of photos of the seafloor near the Northern San Andreas Fault. Image courtesy of San Andreas Fault 2010 Expedition, NOAA-OER. Download image (jpg, 143 KB).
For multibeam operations, the expedition used a Reson 8101 multibeam sonar aboard the Derek M. Baylis to study the expression of the fault at the surface of the seafloor. The multibeam was mounted on a specially designed pole below the depth of the sailboat’s keel. Between data collected during this expedition, which mapped the majority of the fault offshore in Federal Waters and work done by the California State Waters mapping program, the entire length of the fault between Point Arena and Point Delgada has now been mapped. Complete coverage of the fault has an average resolution of about 2m. The data collected also includes backscatter data over the same area, with an average resolution of 50cm.
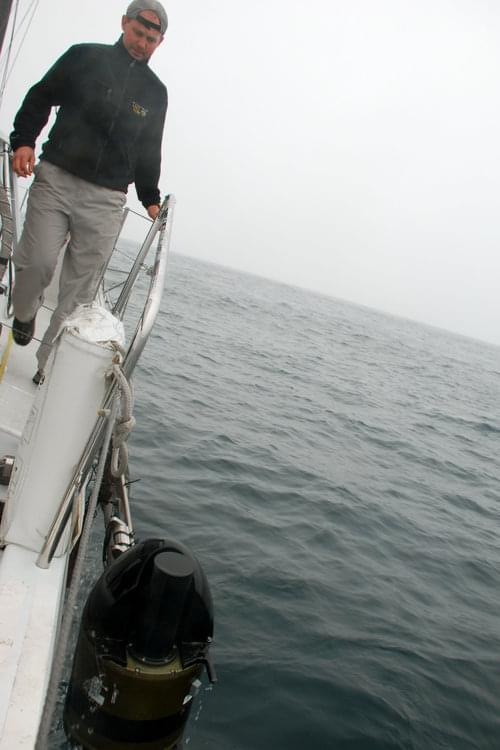
After surveying several multibeam lines, graduate student Morgan Erhardt brings the Reson 8101 out of the water for transit. The multibeam was mounted on a specially designed pole beneath the depth of the sailboat’s keel. Image courtesy of San Andreas Fault 2010 Expedition, NOAA-OER. Download image (jpg, 84 KB).
The new mapping coverage revealed the fault to be a dramatic escarpment on the continental shelf and exhibits classic strike-slip features, with pop-up and pull-apart basins along its length related to gentle strike changes of the fault. The fault is well expressed where it captures and offsets the head of Noyo Canyon. Multibeam data also revealed several fault splays that are related to uplifted banks along the fault. It was observed that the fault does come ashore at Point Delgada.
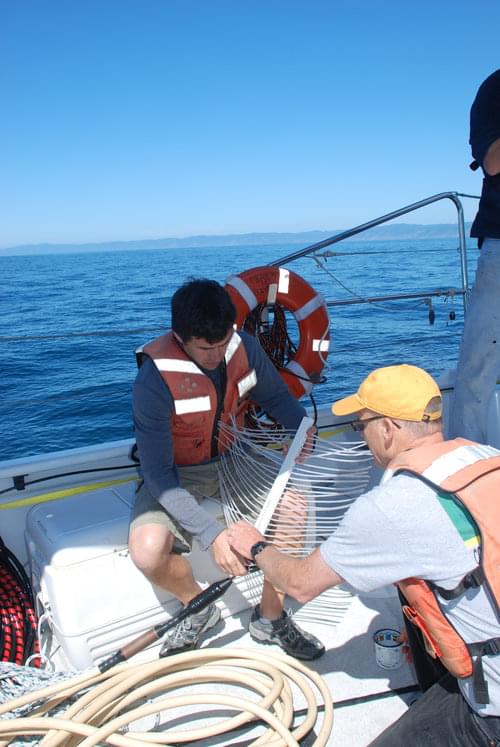
Jackson Currie and Sam Johnson from USGS prepare the “mini-sparker” for deployment. The “mini-sparker” sends out a “shot” every half or one second depending on water depth, and the sound of the shot bouncing back helps determine the hardness of the subsurface layers of the ocean bottom. Data from the “mini-sparker” creates an image of the cross section of the fault, revealing the structure of the fault and sediments surrounding it. Image courtesy of San Andreas Fault 2010 Expedition, NOAA-OER. Download image (jpg, 133 KB).
In the next part of the expedition, the seismic operations, data on the layers of sediment and rock, deep under the surface of the seafloor, were collected using a system called a seismic reflection “mini-sparker” deployed from Baylis. The OSU and USGS teams collected 58 seismic profiles in a grid across the fault at a spacing of 1km. The lines, combined with 51 lines previously collected by USGS earlier in the summer comprise the most dense seismic grid ever collected across the San Andreas Fault, and possibly any plate boundary fault. Seismic profiling revealed highly variable structure along the fault. In some places, the fault was a simple structure, and remarkably constrained to a very narrow zone of hundreds of meters width. In other areas, the fault zone was kilometers wide, had multiple main traces and was highly diverse in structural expression. The mini sparker profiles were of excellent quality, and will provide a very high-resolution 3D model of the fault system when the data are processed and assembled into a 3D grid.
Researchers and engineers from the NOAA Fisheries and Woods Hole Oceanographic Institution aboard the research vessel Pacific Storm used the AUV Lucille and a multi-frequency quantitative sonar system to survey the seafloor and water column around the NASF, previously mapped by the team on the Baylis. The AUV’s advanced optical cameras were used to image surface features of the seabed and characterize habitats with their associated fauna. The multi-frequency Simrad EK60 sonar system was used to image animals living in the water column—the “nekton” and “zooplankton”, especially aggregations of individuals such as fish schools, and those that often appear as layers comprised of smaller fishes, squid, and crustaceans such as shrimp and krill.
During the eight days that AUV and sonar operations were conducted on board the Pacific Storm, 14 AUV missions were completed and AUV Lucille returned tens of thousands of photos of the seafloor. At three of the AUV dive sites, the fisheries sonar system was used to conduct surveys of scattering layers in the overlying water column at three frequencies.
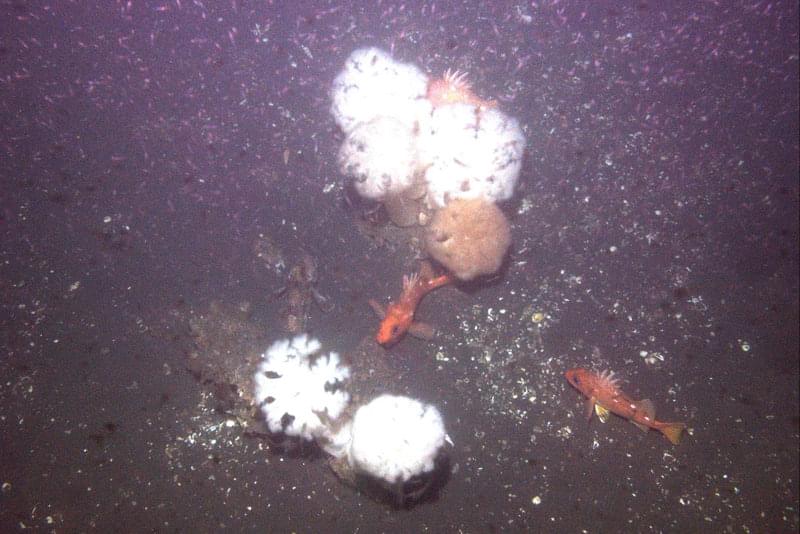
Image taken by AUV Lucille of plankton, rockfish, sculpin and anemones at the Northern San Andreas Fault site. Image courtesy of NOAA-NWFSC. Download image (jpg, 150 KB).
The photos taken by the AUV provided researchers with information about the composition of the seafloor, along with associated fish and invertebrate communities. Shoreward and seaward of the fault the sedimentary environments were inhabited by the fishes and invertebrates commonly known for this area of the California Current, including commercial and non-commercial flatfishes and skates, as well as, sculpins and poachers. Where the NSAF outcropped, the AUV’s images revealed a rich invertebrate fauna characteristic of high-current areas with dense aggregations of feather stars or crinoids, anemones, basket stars, and in some areas sponges. Feather stars and basket stars are known to inhabit rocky habitats in areas of strong currents that deliver food to these filter feeding organisms. Analysis of seafloor images can be very time consuming, especially if it involves the identification and enumeration of organisms. Considerable time in the lab awaits NOAA Fisheries scientists conducting analysis of images from the AUV that will be used to illustrate distributional patterns in fish and invertebrate assemblages associated with the NSAF.
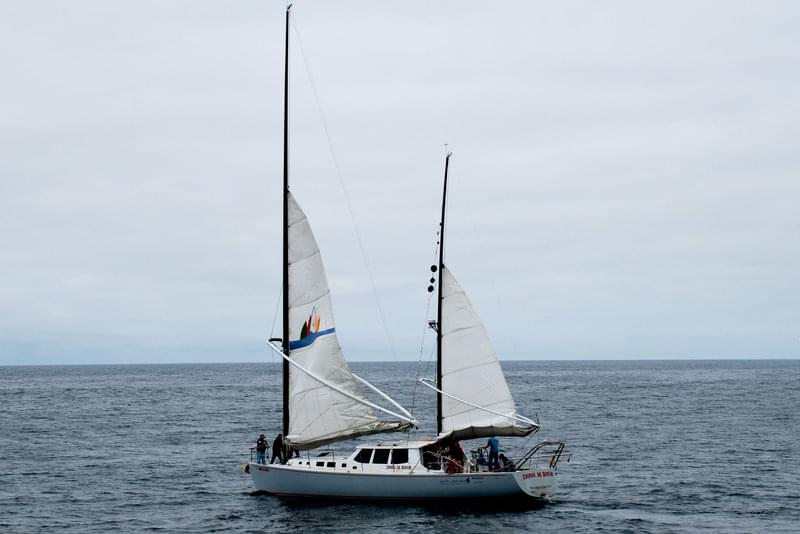
The Derek M. Baylis, a San Francisco-based sailboat owned by Sea Life Conservation helped make the San Andreas project a “green” oceanographic research project. Powered by a combination of wind and diesel, the Baylis runs quietly and emits little pollution. During the entire expedition, the Baylis’ average fuel consumption was 1.6 gallons per hour. Image courtesy of San Andreas Fault 2010 Expedition, NOAA-OER. Download image (jpg, 82 KB).
The research group also focused on making their research as “green” as possible. The Baylis, a San Francisco-based sailboat owned by Sea Life Conservation, is powered by a combination of wind and diesel. The Baylis runs quietly, and emits little pollution. Due to its hull construction and design, the Baylis’s average fuel consumption was 1.6 gallons per hour. Comparatively, the more standard research vessel, the Pacific Storm, used anywhere from 12 – 22 gallons of fuel per hour, depending on the mode of operations.
During this exploration, we completed the first comprehensive high-resolution multibeam sonar and seismic reflection survey of the NSAF. When combined, data from these two complementary geophysical surveys will provide an unprecedented high-resolution 3D visualization of the fault system. In addition, digital photographs and photomosaics obtained with a hovering autonomous AUV will provide the collaborative team of geologists and biologists with logDirect observation of the seafloor and associated biological communities at selected sites. Mapping and imaging the NSAF at georeferenced spatial scales from kilometers to meters will support ongoing studies and discoveries on the nature of the NSAF and contribute to the assessment of marine habitats in the California Current Ecosystem. Finally, the exploration provided a case study and outreach opportunity for conducting a “green” oceanographic research project.