By Kate Stafford - Applied Physics Laboratory, University of Washington
September 3, 2012

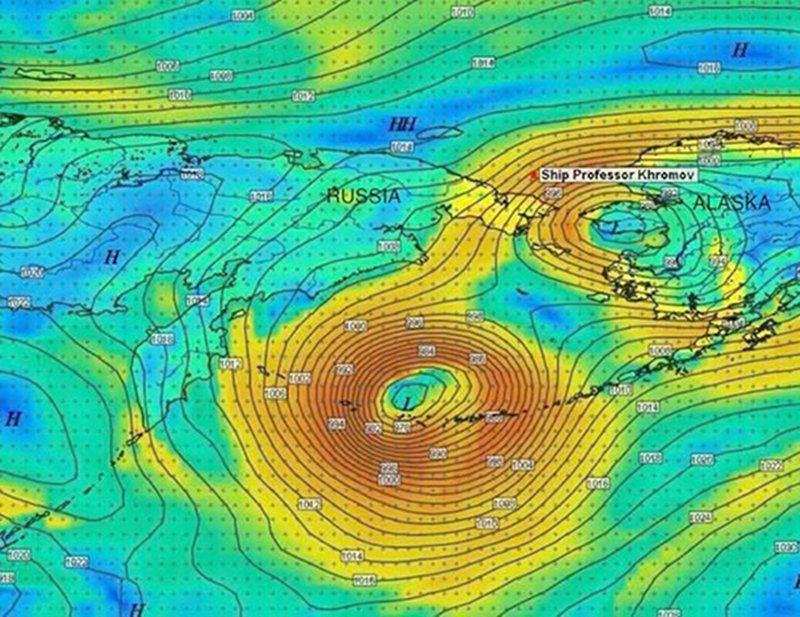
This map from September 3 shows the weather patterns that plague the scientists on the second leg of the Russian-American Long-term Census of the Arctic 2012 cruise. Image courtesy of the 2012 RUSALCA Expedition, RAS-NOAA. Download image (jpg, 190 KB).
We are at a science standstill right now, hostage to two low-pressure systems, one currently in the southwest Bering Sea and the other over Norton Sound.
Even the valiant Conductivity-Temperature-Depth (CTD) team has had to call it quits. On the weather map, the low-pressure systems are the bullseyes with “L” in the center. The closer the rings in the bullseye, the higher the winds and the worse the storm. As bad as it is up here in the Chukchi (see the red dot and label for the vessel Professor Khromov's location), we are all grateful that we aren't just north of the Aleutian Islands in the Bering Sea.
At present, we are headed northwest towards Wrangel Island in the hope that we might find calmer weather (and not too much ice) so we can get back to sampling. Morale remains pretty high on board so far, although everyone is getting a little tired of the constant buffeting about.