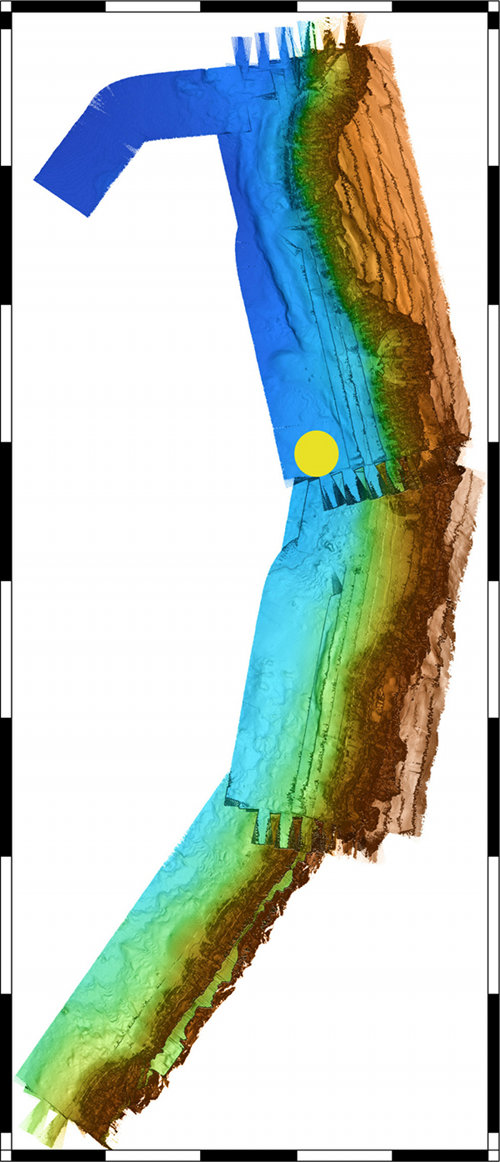

Here’s the map that Sentry made overnight – or rather, the first-cut version of the map that Dana made after lunch today using the data acquired by Sentry overnight. This is by no means the final version but it is good enough for us to plan our follow-on surveys and certainly shows we have all the data that we wanted to collect. The deep blues on the map reflect depths of 2900-3000 meters to the North and West while the brown colors to the South and East represent the top of the rise that marks the transition from the Ocean Crust of the SE Pacific to the continental margin of South America. We’re pretty sure the source of a our methane anomalies lies somewhere on this map, perhaps associated with the steep scarp that marks the brown-blue transition that runs down the middle of the image.