
By Chuck Meide, Director of the Lighthouse Archaeological Maritime Program - Lighthouse Archaeological Maritime Program
July 19, 2014
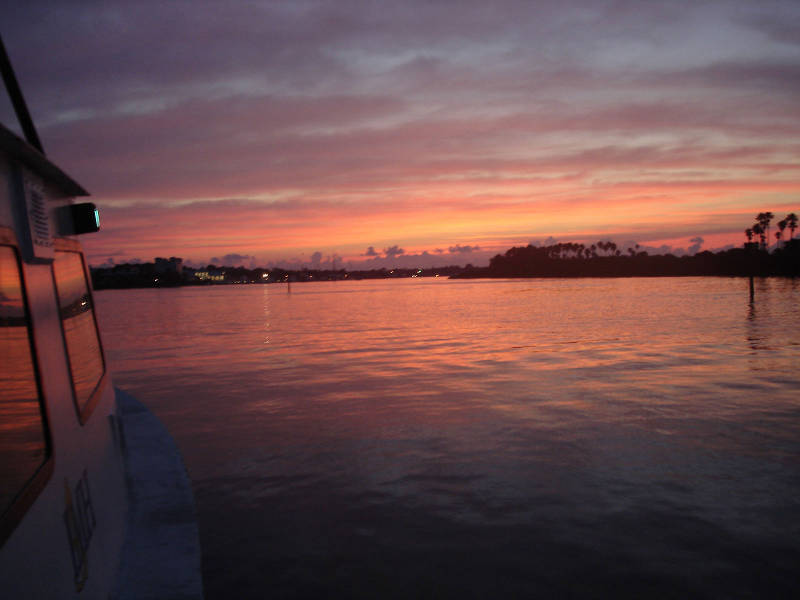
Roper heads out into the sunrise, leaving the New Smyrna Beach City Marina by 6:00 am and departing for the survey area. Image courtesy of Image courtesy of the Search for the Lost French Fleet of 1565 Expedition, NOAA-OER/St. Augustine Lighthouse & Museum. Download larger version (jpg, 188 KB).
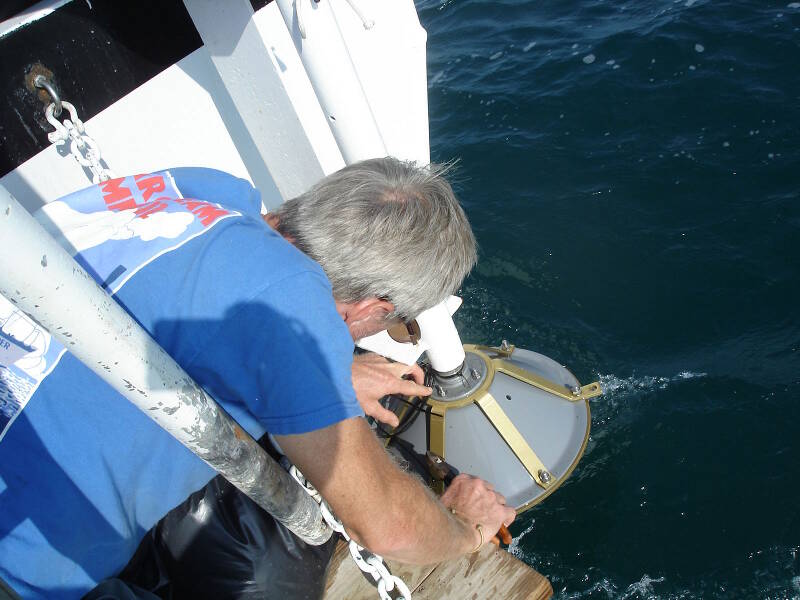
Dr. Turner securing the subbottom transducer at the stern of the boat. When deployed, it is lowered into the water where it sends its sonar pings down into the seafloor below. Image courtesy of Image courtesy of the Search for the Lost French Fleet of 1565 Expedition, NOAA-OER/St. Augustine Lighthouse & Museum. Download larger version (jpg, 294 KB).
We woke up this morning just before 6:00 am. We had spent the night at the New Smyrna Beach City Marina, since the weather forecast had been dire. But the seas are flat on these inland waters. After a brief stop to take on 129.44 gallons of diesel fuel and 24 additional pounds of ice, we head out the Ponce Inlet and make our way south to Canaveral.
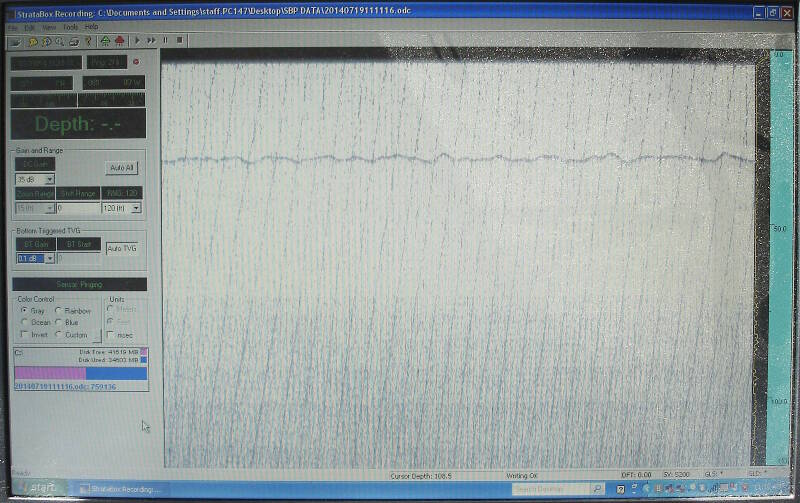
A view of the subbottom profiler laptop screen as it is collecting data today. The somewhat hazy, wavy horizontal line running across the upper portion of the screen is the profile of the seafloor below the boat. Image courtesy of Image courtesy of the Search for the Lost French Fleet of 1565 Expedition, NOAA-OER/St. Augustine Lighthouse & Museum. Download larger version (jpg, 435 KB).
For the past four days, our crew has been piloting Roper back and forth, back and forth throughout the survey area, towing a variety of geophysical or remote sensing equipment as we complete individual five-mile lanes, slowly but surely covering as much of the survey area as we can safely access (the lanes closest to the beach become too shallow for our boat, though we push it as best we can by using the highest tides to get those inshore lanes). The beach as seen from the water has gotten pretty familiar by this time!
Yesterday, I wrote about some of our first noticeable magnetic anomalies, which have gotten everyone excited about the prospects of finding these French shipwrecks.
Today, I thought I’d focus on our acoustic devices. These sonar units, unlike the magnetometer which generates numbers representing the Earth’s magnetic field, provide visual data. Both the subbottom profiler and the sidescan sonar send soundwaves to the seafloor, and then interpret the return signal (the soundwaves that bounce back from the seafloor or from sediments or objects beneath the seafloor) to generate an image or sonogram of the seafloor. In this respect, these devices are similar to the use of ultrasound to generate images of prenatal babies, though on a much vaster scale.
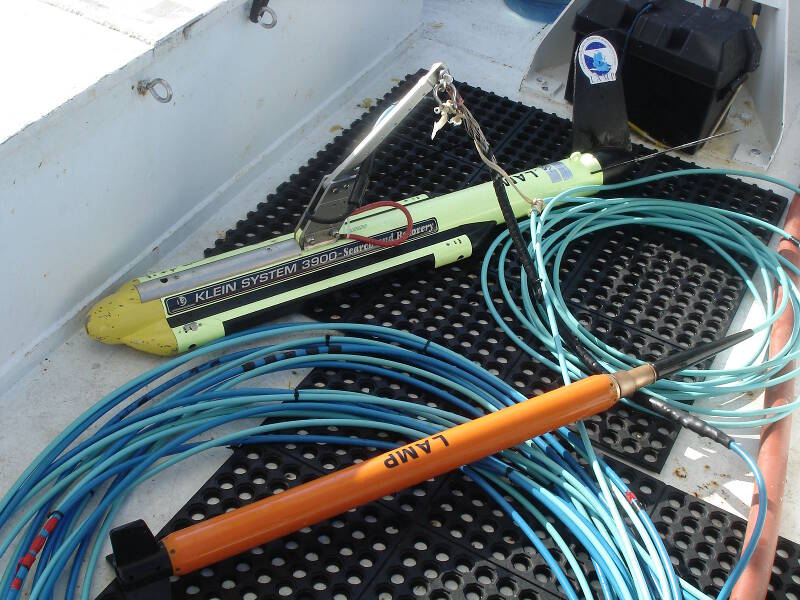
The yellow, torpedo-like object is our sidescan sonar fish, a Klein System 3900. The slender orange unit is the Marine Magnetics Explorer Mini-Magnetometer. Image courtesy of Image courtesy of the Search for the Lost French Fleet of 1565 Expedition, NOAA-OER/St. Augustine Lighthouse & Museum. Download larger version (jpg, 424 KB).
Our subbottom profiler is a SyQwest StrataBox. We first used this model in 2009, when we had one on loan from the University of West Florida, and it was helpful in identifying at least one buried shipwreck site when used in conjunction with the magnetometer.
Unlike some versions of subbottom profilers, this one is not towed from the boat. Instead, its working end consists of a cone-like transducer, which is mounted on a vertical pole and is lowered into the water. We have a mounting bracket on the stern of our boat which holds it securely, and it is lowered around four feet into the sea, where it can send and receive a clear signal.
From this position, the subbottom profiler sends “pings” of sound down into the seafloor. The sound will reflect off the seafloor, but some will also penetrate the seabed and be reflected back when it hits a different layer of sediment or an object (like a shipwreck) that has a different acoustic impedance. The sound waves that bounce back are received by the transducer, and the computer reading the signal uses this reflected energy to provide information on sediment layers or other objects beneath the seafloor.
This technology is often used by marine archaeologists searching for submerged prehistoric sites which used to be on dry land during times of lower sea levels, as it can be very useful for identifying ancient river channels now buried in the seafloor. They traditionally are used less by shipwreck archaeologists. One reason for this is that the magnetometer is such a useful tool for locating wrecks, but another is that the subbottom profiler only detects object directly under the research vessel, and cannot “see” anything to either side, so the chances of running directly over a wreck are smaller when our survey lanes are spaced 20 meters apart.
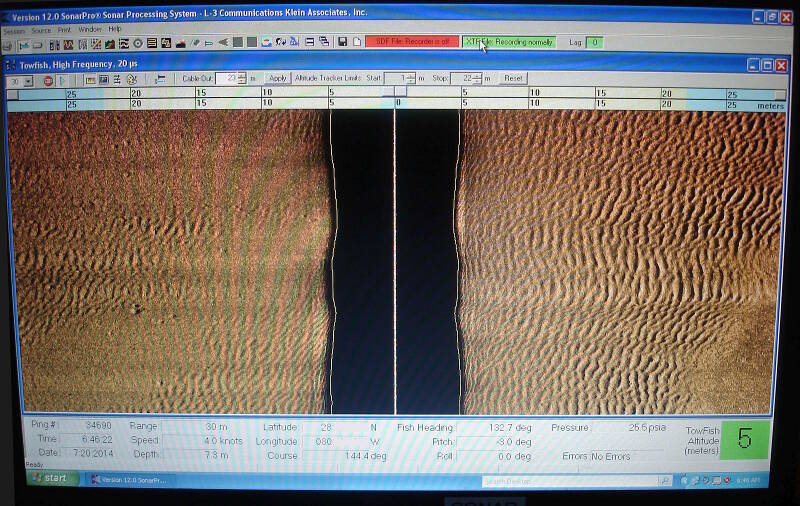
Here is the sidescan sonar display during survey, showing a sandy bottom. Image courtesy of Image courtesy of the Search for the Lost French Fleet of 1565 Expedition, NOAA-OER/St. Augustine Lighthouse & Museum. Download larger version (jpg, 547 KB).
The sidescan sonar, unlike the subbottom profiler, can “see” on either side of the boat, and its range can be set to see some distance to either side if desired. This allows us to search more of the ocean floor in a shorter amount of time. The sidescan sends sound waves out from either side of the towfish unit, which is towed behind or to one side of the survey vessel. The acoustic waves are reflected off the seafloor and received by the towed unit, and then displayed in real time as a scrolling plan view or image of the seafloor.
I often tell folks that the sidescan lets us see the ocean floor as if we could magically make the water disappear and take aerial photos.
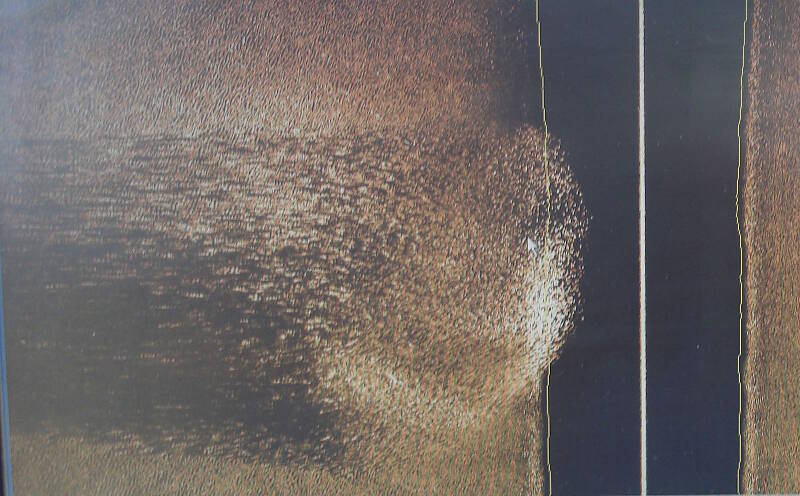
Sidescan image of a massive school of fish swimming under the research vessel during survey. Image courtesy of Image courtesy of the Search for the Lost French Fleet of 1565 Expedition, NOAA-OER/St. Augustine Lighthouse & Museum. Download larger version (jpg, 353 KB).
The image to the right is what the sidescan sonar display looks like to the scientists on the boat. The large black band running vertically down the center of the screen is the nadir zone, or the blind spot located directly under our boat where the sidescan cannot “see.” On either side we can see the seafloor out to a distance of 30 meters from the boat. Sand ripples can be seen on the ocean floor beneath us, with no sign of manmade objects such as ship wreckage.
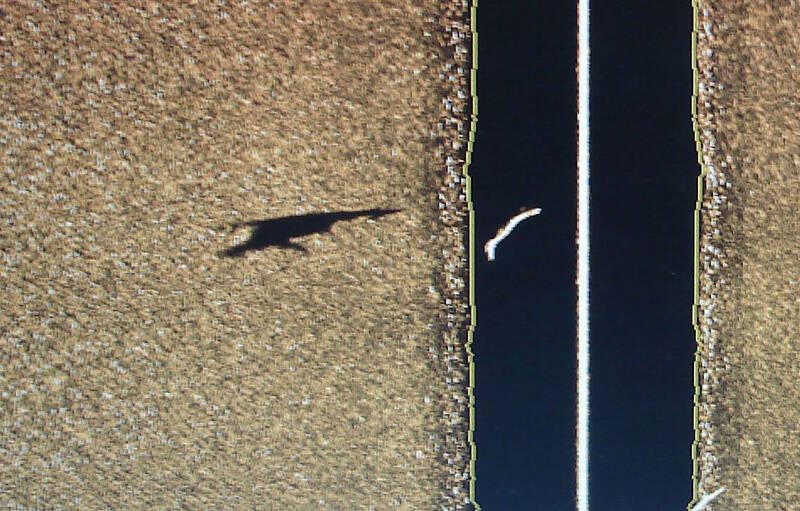
This is a beautiful sidescan image of a large hammerhead shark swimming under our research vessel. Image courtesy of Image courtesy of the Search for the Lost French Fleet of 1565 Expedition, NOAA-OER/St. Augustine Lighthouse & Museum. Download larger version (jpg, 225 KB).
The sidescan also picks up all kinds of interesting marine life. For example, see the image of a HUGE school of fish, around 20 meters across! You can also see the acoustic shadow on the left side of the school of fish, where their bodies are blocking the soundwaves, creating a shadown much like that which would be seen if a powerful spotlight was focused on them.
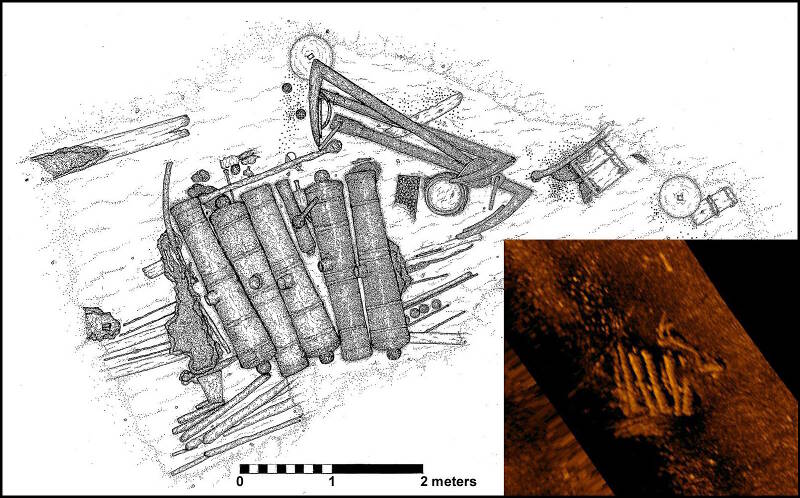
Above is an example of a sidescan sonar image of a shipwreck, compared with the site plan drawn by archaeologists. This shipwreck is the Industry, a British supply ship lost in 1764 off the coast of St. Augustine. The site plan shows cannons, anchors, and other cargo items, most of which can be distinguished in the sonar image inset at lower right. Image courtesy of Image courtesy of the Search for the Lost French Fleet of 1565 Expedition, NOAA-OER/St. Augustine Lighthouse & Museum. Download larger version (jpg, 417 KB).
We also collected another great image of marine life, this time of a large hammerhead shark that swam under our boat. The shark itself is seen in the water column, or the vertical black nadir zone, and is depicted as the yellow strip in the black zone. Its shadow, to the left, shows a more recognizable outline of a shark with the distinctively shaped head of the hammerhead.
Of course, while it is fun to look at the marine life and sand ripples, we are archaeologists, not marine biologists or geologists. So we are mostly interested in man-made objects protruding from the seafloor. If an historic shipwreck or a scatter of wreckage is exposed on the ocean floor, we should be able to see it with the sidescan. If it is buried, it will be invisible to the sidescan, though it could possibly be discerned by the subbottom, and likely by the magnetometer.
With all three devices used in conjunction, we have the best chance of locating and identifying a shipwreck from the lost French Fleet. In the image above, you can see the drawing of a 1764 shipwreck site made by archaeologists, compared with the sidescan image of that same shipwreck.
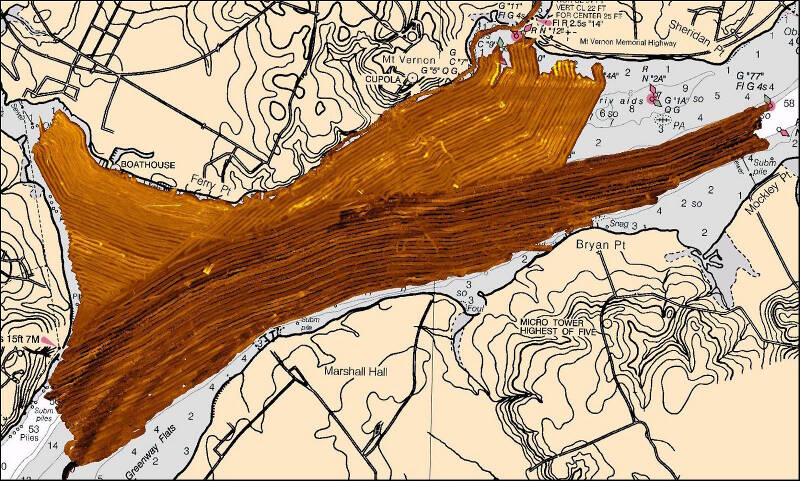
This image is the result of a survey conducted by LAMP and the Institute of Maritime History in the waters off Mt. Vernon, George Washington’s home. All of the sidescan sonar images produced by the survey have been mosaicked together using geographic position data from the GPS. Mosaics give us a seamless view of the entire area of seafloor scanned with the sonar, and let scientists know exactly what area we have successfully covered. This map was produced with SonarWiz.MAP software. Image courtesy of Image courtesy of the Search for the Lost French Fleet of 1565 Expedition, NOAA-OER/St. Augustine Lighthouse & Museum. Download larger version (jpg, 566 KB).
There are all kinds of neat things we can do with the sidescan data. Software packages exist which allow us to tweak the data and make the most of it in a variety of ways. The best of these softwares, in our opinion, is SonarWiz.MAP, produced by Chesapeake Technology. We use this software for data processing, analysis, and mosaicking images. The mosaicking is one of the coolest aspects of the program. It lets us seamlessly assemble all of the sidescan images so we can see the total coverage, while still allowing us to zoom in to any particular area to scrutinize in detail.
By the end of the day, we had finished eight survey lanes. This was despite a late start due to our transit from New Smyrna Beach to Canaveral. It was a great day, and just what we needed to help us catch up to our original survey goals.
We had hoped to complete 35 survey lanes, and we only have two to go! Tomorrow is the last day of the cruise, and it was a planned travel day, from Canaveral back to our home port of St. Augustine. Our plan is to finish the final two survey lanes, and then head for home! Spirits are high, as for a time we had fallen so far behind schedule we were worried we wouldn’t accomplish our goals.
But now we are poised to meet our goals. And, somewhere in the gigabytes of computer data we have generated may be the signature of one of the lost French Fleet. We may have found it already!