By Matthew Lawrence, Maritime Archaeologist, NOAA Office of National Marine Sanctuaries - Maritime Heritage Program
September 13, 2015

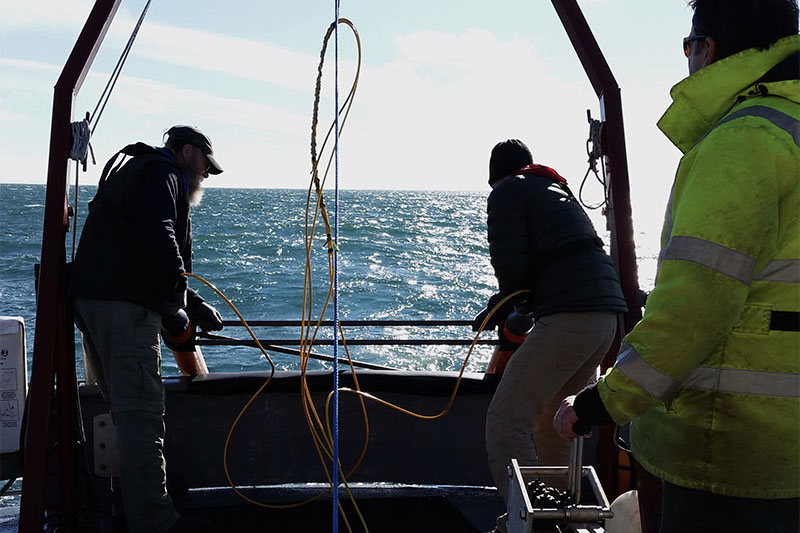
Photo of Matthew Lawrence and Brad Barr deploying the gradiometer (with Captain Mike Fleming at the winch) during one of the early test runs. Image courtesy of NOAA/ONMS/Evan Martzial. Download larger version (jpg, 2 MB).
During the search for shipwrecks, archaeologists rely on magnetometers to locate ferromagnetic material associated with the shipwreck. Magnetometers detect variations in the Earth’s magnetic field caused by iron or other magnetized material such as brick or rock. Unlike acoustic sensors such as side scan sonar or multibeam sonar, magnetometers can detect this material even if it is buried.
The basic principle of magnetometry is that the Earth is something like a bar magnet oriented from the North Magnetic Pole to the South Magnetic Pole. Magnetic field lines emanate from these poles, interacting with ferromagnetic material. The variation in the Earth’s magnetic field caused by this interaction is called “induced magnetism.”

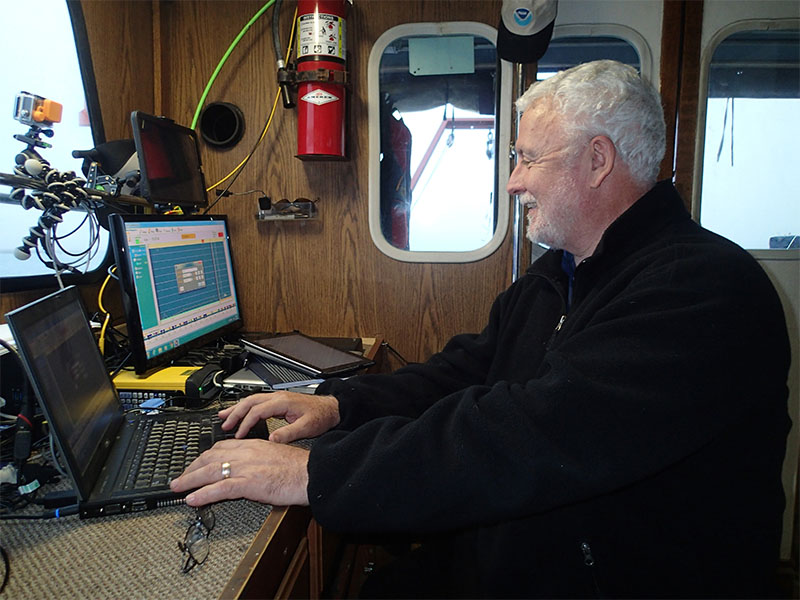
Jim Delgado monitoring the output from the magnetometer. Image courtesy of NOAA/ONMS/Matthew Lawrence. Download larger version (jpg, 2.1 MB).
Ferromagnetic material also has permanent magnetization caused by the alignment of the material’s atomic structure to the Earth’s magnetic field during the objects production by heating; for example, when the iron used to create an anchor is smelted and then forged.
The combination of induced and permanent magnetism represents the total field magnetism of an object.
Magnetometer manufacturers use a variety of electrical processes to create sensors that passively measure the Earth’s total magnetic field. These various techniques, known as proton precession, cesium-vapor, and Overhauser effect, amongst others, all measure and interpret the atomic physics of a material to obtain a total magnetic field reading.
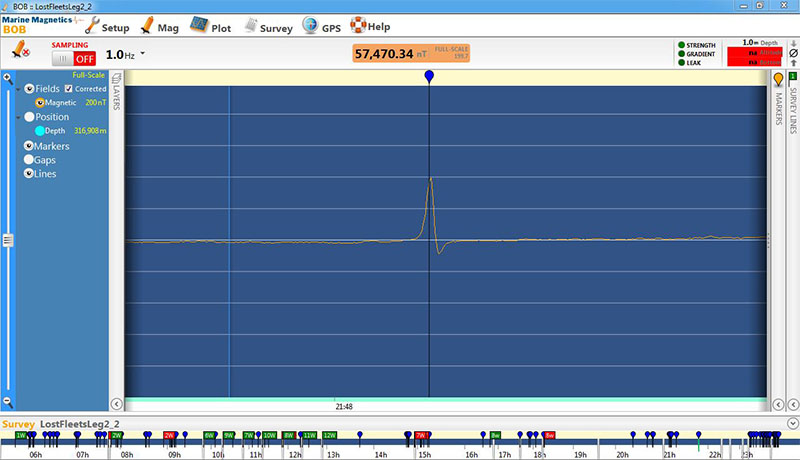
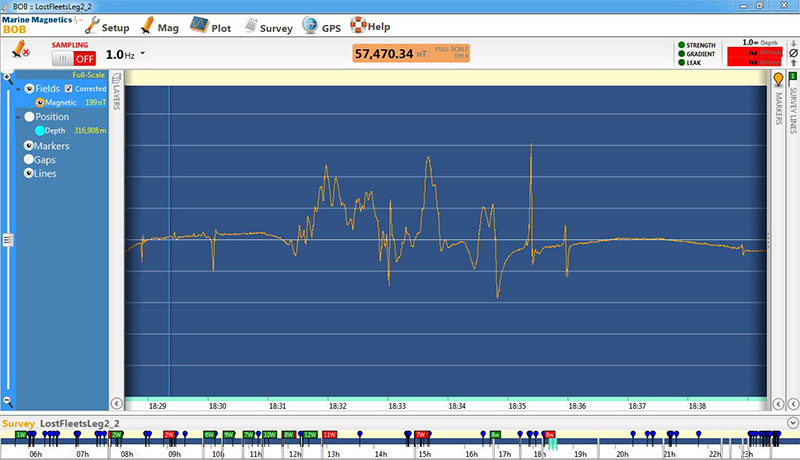
When the magnetometer electronics are placed within a waterproof cylinder and towed behind a research vessel, archaeologists can then collect magnetic total field readings at intervals to determine where ferromagnetic material is located. The resulting numerical readings are generally displayed graphically through the magnetometer’s computer interface as the total field reading on the Y-axis of a graph with the X-axis represented by time. Were the magnetometer to pass over a ferromagnetic object, like an anchor, the line would display a short duration peak and valley where the magnetometer encountered variation in the total magnetic field that was different than the area’s background magnetism. Archaeologists call this variation an anomaly.
Complicating the interpretation of magnetometer data, the Earth’s magnetic field varies throughout the day. This phenomenon is due to differences in the Earth’s orientation to the Sun caused by its rotation and is known as diurnal variation. One of the challenges of archaeological magnetometry is to differentiate the variation in the Earth’s magnetic field caused by ferromagnetic material from background changes caused by diurnal variation or large-scale magnetic geology. Otherwise stated, this is considered identifying the signal from the noise.
The Search for the Lost Whaling Fleets of the Western Arctic expedition employed three magnetometers to locate the ferromagnetic material from the sunken whaleships on the seafloor.
One magnetometer is called a base station and was deployed at a single spot onshore adjacent to the survey area. Since the base station did not move, simply recorded the total magnetic field and was used to ascertain the variation in the magnetic field caused by diurnal variation. The base station data will be subtracted from the data recorded by one of the other magnetometers towed through the survey area. Removal of the background diurnal noise will make anomalies easier to identify.
The other two magnetometers were towed together behind the research vessel locked into a rigid frame that separates the magnetometer towfish from each other by a distance of 1.5 meters. This combined instrument is called a horizontal gradiometer. Using software, the gradiometer takes simultaneous readings from the towfish and then calculates the difference in the total field intensity divided by the distance between the magnetometers thus yielding a linear estimate of the magnetic gradient. The advantage of using a gradiometer is that it reduces the potential for background noise and large-scale geologic features to obscure anomalies resulting from shipwreck material.

Magnetometer readout image of a single dipole, likely a small isolated object. Image courtesy of NOAA/ONMS/Matthew Lawrence. Download larger version (jpg, 166 KB).

Magnetometer readout image of multiple anomalies grouped together that likely represents a mass of material from one of the whaleships. Image courtesy of NOAA/ONMS/Matthew Lawrence. Download larger version (jpg, 190 KB).
During most archaeological surveys, either a gradiometer or a magnetometer and base station are used, as most archaeological research projects do not have access to both instrument varieties. Given the remote nature of this survey area and the difficulty and cost to reach it, this project used both methodologies and will compare the methodologies’ efficacy. Gradiometers may not yield the most accurate source locations as the gradient varies dependent upon the orientation of the gradiometer to ferromagnetic material located in the survey area. Gradiometer data can also be distorted by the permanent magnetism of the ferromagnetic objects it encounters.
Both of the resulting datasets will be contoured in two dimensions to visually represent either the total magnetic field or total magnetic field gradient. Anomalies will be represented as variously colored spikes and pits against a largely consistent background color. Anomalies with high intensity and multiple spikes and/or pits that are close together are of particular interest as they may represent the numerous iron components expected to be found on a whaleship shipwreck.
Furthermore, contour maps were overlaid on top of the sonar target maps created with the project’s acoustic sensors. Magnetic anomalies that coincided with sonar targets were followed up with ground truthing by the project’s underwater imaging system.