By Professor Jeff Welker and Dr. Eric Klein, Department of Biological Sciences, University of Alaska, Anchorage
July 20, 2016

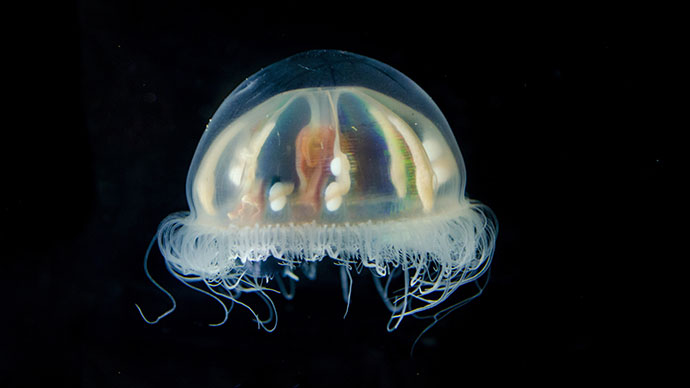
Isotopes are everywhere and can help scientists map intricate food webs. It is essential that the Arctic food web is better understood as the climate continues to change. Image courtesy of Caitlin Bailey, GFOE, The Hidden Ocean 2016: Chukchi Borderlands. Download larger version (1.7 MB).
The hydrologic (water) and carbon cycles in the changing Arctic are highly complex and require an understanding of the biological, chemical, and physical processes that drive these cycles. One tool that scientists use to study these systems is stable isotope geochemistry.
Oxygen (O), hydrogen (H), and carbon (C) have naturally occurring and less abundant stable isotope forms, which are the same as the more common form, but additional neutrons make them heavier. The heavy forms of these elements respond differently to environmental conditions than their light counterparts, which results in a chemical signature of these conditions. The ratio (or delta, δ) of heavy to light isotopes compared to known values, referred to as standards, is expressed in per mil (‰) units and results in the following notation: δ18O, δ2H, and δ13C.
These isotopic values can be used to trace various Earth system processes in marine and terrestrial environments. The differential response of δ18O and δ2H to temperature, for instance, allows for the reconstruction of past climate change, which provides context to current and future patterns of Earth’s history. For example, the δ18O values of carbonate shells, such as from a snail, can serve as an indicator of water temperature when the shell was formed. The δ2H value in marine air can also reflect moisture sources (e.g., Arctic or Pacific) or sea ice extent. Carbon isotopes may be used to measure ocean productivity and help reveal an organism’s food source and possible preference for benthic or pelagic prey.
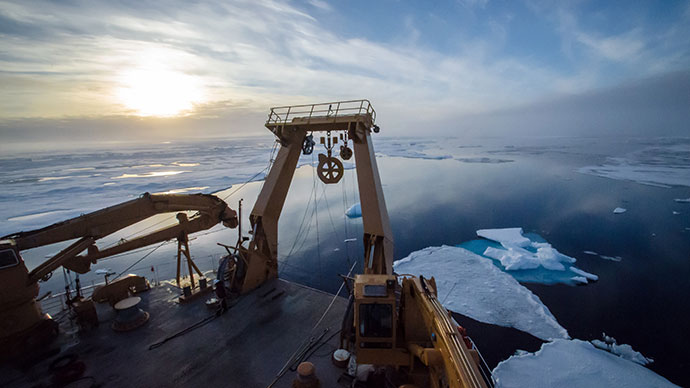
 that is measuring the oxygen and hydrogen isotopic values of water vapor through a pipe system that leads to the upper bow of the U.S. Coast Guard Cutter Healy.")
Jeff Welker and Eric Klein look at a spectrometer (endearingly called "Pippin") that is measuring the oxygen and hydrogen isotopic values of water vapor through a pipe system that leads to the upper bow of the U.S. Coast Guard Cutter Healy. Image courtesy of Caitlin Bailey, GFOE, The Hidden Ocean 2016: Chukchi Borderlands. Download larger version (3.8 MB).

This spectrometer system, called "Gandalf," measures isotopic values in seawater that is continuously being pumped through the system. Image courtesy of Jeff Welker, UAA, The Hidden Ocean 2016: Chukchi Borderlands. Download image (83 KB).
The Hidden Ocean expedition marks the second summer we have outfitted the U.S. Coast Guard Cutter Healy with laser-based spectrometers (Picarro Inc.) to study Arctic biogeo-chemical processes. During this expedition, we are continuously (approximately once per second) measuring the δ18O and δ2H values of water vapor and seawater (the first time ever in the U.S. Arctic for seawater!), the concentration of carbon dioxide (CO2) and its δ13C-value, and the concentration and δ13C of methane (CH4).
These continuous measurements have revealed exciting, unforeseen nuances in the Arctic Ocean’s hydrologic and carbon cycles. There are dramatic changes in the behavior of O and H isotopes when ocean water evaporates. As these evaporation-driven isotope changes are also influenced by sea ice extent, our findings can help interpret changes in historical δ18O and δ2H values in ice cores as a reflection of sea ice extent surrounding Greenland.

This data, taken continuously every second, shows a methane spike that suggests methane might accumulate under the sea ice. Image courtesy of Jeff Welker, UAA, The Hidden Ocean 2016: Chukchi Borderlands. Download image (115 KB).
We have also found a distinct photosynthetic signal in the daily variation of the stable isotope composition (δ13C) of CO2, that is more pronounced than just the concentration variation we observe. Assimilation of CO2 is highest in the middle of the day, coincident with maximum sunlight. This diurnal pattern becomes less pronounced the farther north we travel, as sea ice cover increases and temperatures drop.
We have also found episodic pulses of methane, or CH4 (a stronger greenhouse gas than CO2, but with a shorter atmospheric life span) during ice breaking, which suggests CH4 might accumulate in the ocean under the sea ice from seafloor methane seeps.
These isotopic measurements are complemented by an entire range of ship-based data, including meteorological parameters (irradiance, air, and sea temperatures), seawater CO2 concentrations, chlorophyll concentrations, and salinity.
We are collaborating with our Hidden Ocean colleagues to construct depth profiles of seawater isotopes for each of our sampling stations. These profiles, combined with the stable isotope composition of the benthic and pelagic organisms, will be used to create an O/H isotope model of the Arctic marine food web, starting with the isotopic content of the foundation (microbes, phytoplankton) and tracing these elements up the chain to zooplankton, crustaceans, and fish.