
By Dr. Amanda Demopoulos, Research Benthic Ecologist, U.S. Geological Survey
Greater than half of all coral species identified to date are found in the deep sea, at water temperatures ranging from 4-12°C. Much like their relatives in shallow-water tropical environments, deep-sea corals come in a wide variety of shapes, colors, and sizes. Yet, finding them in the deep, dark, and remote deep sea is challenging and requires many different tools.
Over 250 years ago, fishermen unintentionally collected the first deep-sea corals in their nets and were curious about what creatures were destroying their gear. However, these early collections were truly collected in the dark, sight unseen, without any information on the environment the corals lived in. Advances in technology have improved our abilities to locate deep-sea corals and observe them in their natural habitat.
While deep-sea corals have been discovered in all the world’s oceans, there are vast areas of the seafloor that have yet to be mapped, let alone explored for the presence of corals. The Exploring Carolina Canyons expedition will apply a suite of tools to help improve understanding about the distribution of deep-sea corals and their associated habitat along the U.S. Southeast continental margin.
Research vessels equipped with sonar systems allow the collection of ocean data essential for exploring the seafloor and predicting where to find corals. On this expedition, we will use high-resolution multibeam mapping (Figure 1) and subbottom profiling (SBP) to characterize the seafloor.
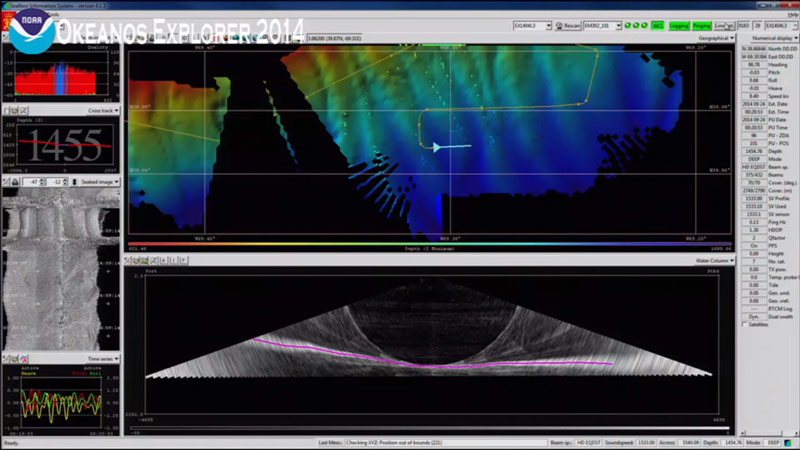
Figure 1: Example of a multibeam sonar survey data display. Image courtesy of NOAA Office of Ocean Exploration and Research. Download larger version (jpg, 442 KB).
Specific data collected will include bathymetry (map of the seafloor); backscatter, which provides information on whether the seafloor is hard or soft and whether there are objects in the water column, like swarms of zooplankton (often food for corals); and subbottom profiles (geological information at and below the seafloor surface). Ultimately, data acquired and analyzed from multibeam sonar surveys allow the creation of 3-dimensional maps of the seafloor (Figure 2) providing detailed images that can help guide scientists to find corals.
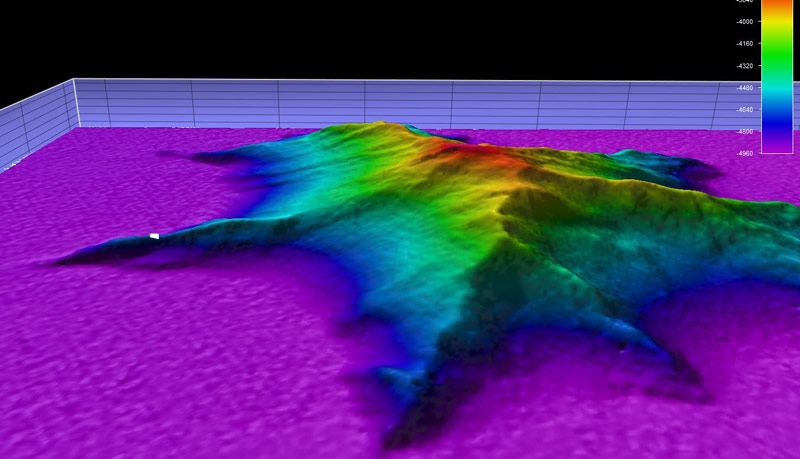
Figure 2: High resolution multibeam map of a newly discovered seamount. The red color corresponds to the seamount summit or peak, while the purple represents the base of the feature. Image courtesy of NOAA Office of Ocean Exploration and Research. Download larger version (jpg, 441 KB).
Similar to multibeam surveys, SBP also uses sound energy, but the lower frequency allows it to penetrate the seafloor, providing more information about the sediment characteristics. This is particularly useful when trying to differentiate areas of coral mounds from the background seafloor. Figure 3 illustrates a coral mound feature, with the characteristic fuzzy or lighter shade (on left) compared to the surrounding seafloor that appears darker in color. The sonar beam moves through the coral mound, because it is like Swiss cheese with lots of holes for the sound to pass through. Once the sound hits the firmer, less porous foundation below the mound, it bounces back to the ship and the resulting trace, or image created via the SBP appears darker.
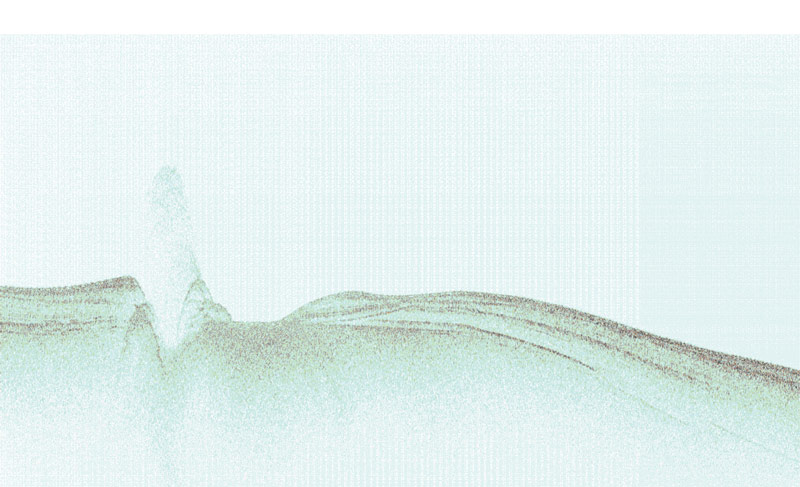
Figure 3: Subbottom profile of the seafloor, with light and hazy vertical feature on the left representing a coral mound. The darker color represents harder, less porous substrate. Image courtesy of F. Mienis, NIOZ. Download larger version (jpg, 1.8 MB).
When multibeam mapping is combined with SBP, scientists can create better maps of the seafloor and resolve whether particular lumps and bumps may be coral mounds or some other seafloor feature.
Deep-sea corals thrive in environments with swift currents that supply them with food. Data obtained from environmental sensors, including fluorometers and sediment chemical analyses, can provide estimates of food available to corals. For this expedition, we will deploy the CTD (Conductivity, Temperature, Depth) rosette near deep-sea coral environments to collect water column data and water samples to filter for particulate organic matter, or food for the corals, and sediment using a corer attached to the bottom of the CTD rosette. Other sensors on the rosette include the transmissometer, which estimates the particulate material and turbidity levels in the water column.
Research conducted in other submarine canyons has measured areas of high turbidity zones, also known as nepheloid layers, where particles concentrate in the water column at specific depths. These layers can be an indication of high food concentration which may fuel deep-sea corals and their inhabitants.
While multibeam mapping and CTDs help provide essential information about the seafloor and water column environment around corals, positive identification of live coral at these locations requires imaging (Figure 4) using a towed camera, submersibles, remotely operated vehicles (ROVs), autonomous underwater vehicles (AUVs, Sentry, Figure 5), and/or seafloor collections.
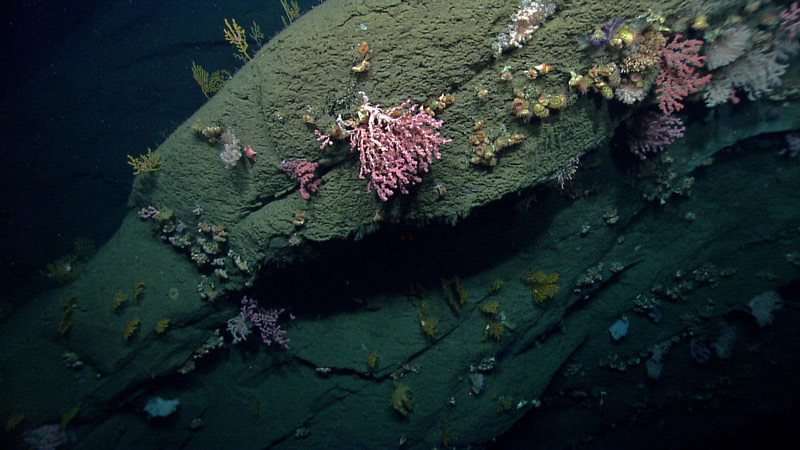
Figure 4: Image of a submarine canyon feature that has been colonized by lots of different types of corals and other animals. Image courtesy of NOAA Office of Ocean Exploration and Research.. Download larger version (jpg, 1.4 MB).
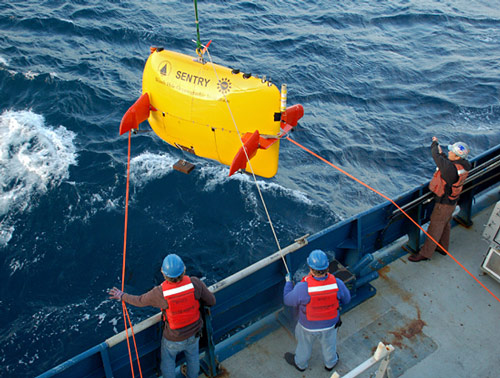
Figure 5: Image of Sentry being deployed from the ship. Image courtesy of C. Reddy, WHOI. Download larger version (jpg, 344 KB).
AUVs in particular are able to conduct large scale and small scale surveys. For this cruise, Sentry will collect images and conduct multibeam mapping and subbottom profiling, in order to characterize the distribution of deep-sea corals and associated seafloor characteristics within the three target submarine canyons. Sentry’s CTD and sensor array will record the environmental conditions around the corals and adjacent habitats, providing us with extensive spatial coverage of these essential data needed for improving predictive models developed to estimate coral distribution.
Because it is impossible to search every square inch of the seafloor for deep-sea corals, predictive models have been developed to help provide an educated guess of the geographical distribution of certain groups of corals. However, in order to improve the predictive ability of these models, critical data are needed to define habitat suitable for deep-sea coral environments. Several factors are included in the models, including depth, seafloor characteristics, a variety of environmental and oceanographic data, and known coral locations. Thus the data collected on this expedition will be incorporated into the models to help improve their predictive capacity. These new and improved models can then produce better regional maps of deep-sea coral habitat locations. They will help with locating undiscovered reefs, and predicting where corals may be present in other, potentially vulnerable habitats.
By using the combination of tools planned for this expedition, discoveries of cold-water corals will be more akin to informed exploration rather than searching for a needle in a haystack with a blindfold on. These tools and techniques have helped improve our discovery of these environments and shape our understanding of what controls their distribution around the globe. Data collected on this expedition will fill critical gaps in our understanding of the deep-sea coral habitats within this region of the U.S. South Atlantic, providing essential data for refining habitat suitability models developed for this area, and ultimately informing the development of future conservation and protection areas.