
By Guy Cochrane, USGS, Klotz Hills, Glacier Bay National Park, AK
March 20, 2016
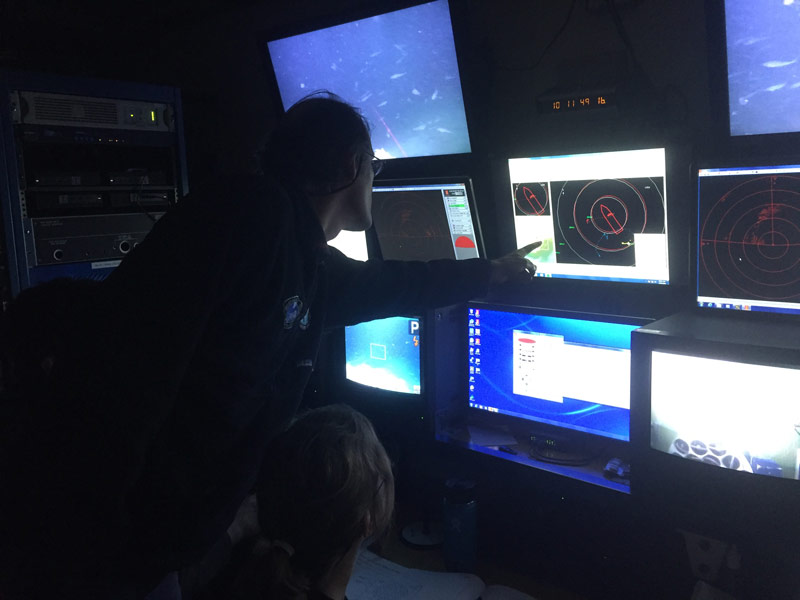
Guy Cochrane monitors the expedition from inside the control van. Image courtesy of the Deepwater Exploration of Glacier Bay National Park expedition. Download larger version (jpg, 2.4 MB).
My specialty is Marine Geophysics and I am the chief of the Seafloor Mapping and Benthic Habitat of the USGS Coastal and Marine Geology Program that has conducted the benthic habitat mapping of Glacier Bay National Park. One of my roles in this expedition is to use multibeam echosounder data to locate likely sites for the presence of coral. The multibeam data is incorporated into a geographic information system (GIS) so that it can be displayed as a map. The Red Tree Coral, Primnoa pacifica, successfully colonizes hard rock because it doesn’t erode and steep slopes (and especially overhangs) because the rock is not covered by silt. Areas of strong current may also be silt free. Red Tree Coral colonizes in water depths below the photic zone where they do not have to compete with algae. The map below uses colors to show the water depth in Muir Inlet where is meets Adams Inlet. Also displayed is the local NOAA chart.
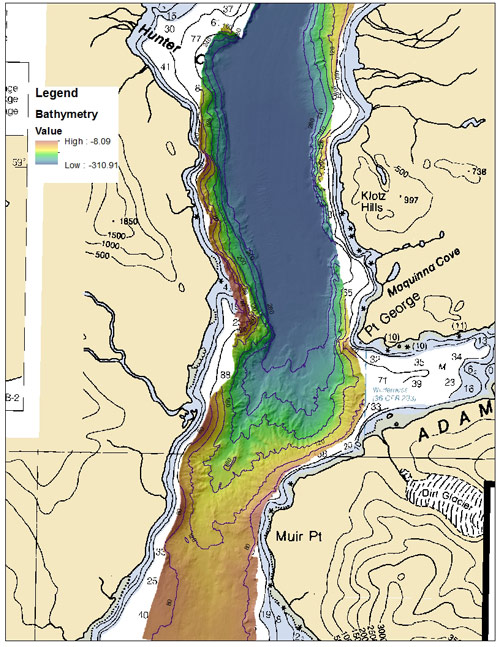
This map uses colors to show the water depth in Muir Inlet where is meets Adams Inlet. Image courtesy of Guy Cochrane, USGS, the Deepwater Exploration of Glacier Bay National Park expedition. Download larger version (jpg, 729 KB).
We also look for coral in areas of high slope which can be calculated from the bathymetry. In the map below, slope data is displayed in the GIS instead of the color-symbolized bathymetry. Slopes greater than 45 degrees are displayed with red coloration. These are areas that we might explore for coral habitat. The GIS we have built for this project can be used to zoom in on an area of interest to be viewed in greater detail. Here, the slope data shows a promontory on the west side of Muir Inlet opposite Klotz Hills that we investigated during Dive 02.
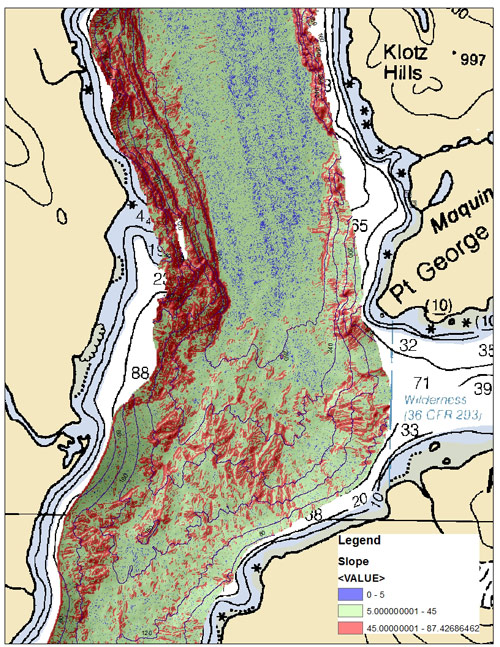
Slope data is displayed in the GIS instead of the color-symbolized bathymetry. Slopes greater than 45 degrees are displayed with red coloration. Image courtesy of Guy Cochrane, USGS, the Deepwater Exploration of Glacier Bay National Park expedition. Download larger version (jpg, 1 MB).
Knowing the rock type is a good indicator of how hard the rocks are. In the map below, a terrestrial geology dataset has been added to the GIS to overlay the NOAA chart. The geologic rock types in the area of the promontory include modern unconsolidated sediment deposits (Qs) and an igneous granodiorite (Kggd). The promontory is more likely to be granodiorite which is a very erosion resistant type of rock. This site was chosen for an ROV dive because it most likely had steep, hard rock surfaces at depths from the surface down to 280 meters, and is in an area of high current speed.
In addition to assisting biologists and fishery managers with identifying likely sites for sampling, my project produces habitat maps, using the Coastal and Marine Ecological Classification Standard in Glacier Bay and other areas. These standardized habitat maps improve our knowledge of the location and type of habitat which helps us manage ecosystems.
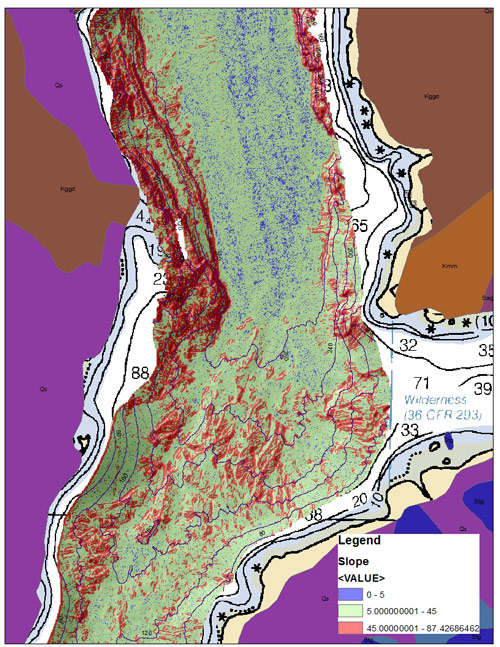
A terrestrial geology dataset has been added to the GIS to overlay the NOAA chart. Image courtesy of Guy Cochrane, USGS, the Deepwater Exploration of Glacier Bay National Park expedition. Download larger version (jpg, 1 MB).
The second ROV dive was conducted in this area shown below, across from Klotz Hills. This map shows the ROV track (black dotted line) overlaid on the map in the GIS. Observations of geology and fauna were logged during the dive and those observations are shown on the map as hollow black circles with the observation comment. You can see from the comments that there were many Red Tree Corals, and some were impressive in size. There were also rock fish (Sebastes sp.) using the coral colonized areas as a habitat. Many other organisms and bedrock were observed, as well as deposits of silt in areas of lesser slope.
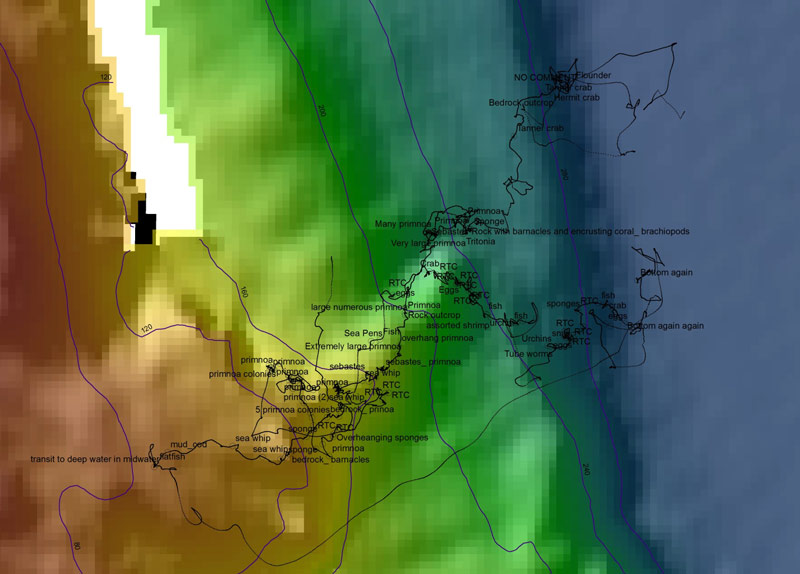
This map shows the ROV track (black dotted line) overlaid on the map in the GIS. Observations of geology and fauna were logged during the dive and those observations are shown on the map as hollow black circles with the observation comment. Image courtesy of Guy Cochrane, USGS, the Deepwater Exploration of Glacier Bay National Park expedition. Download larger version (jpg, 619 KB).