Guam: A Biogeographic and Maritime Cultural Landscape Exploration of a World War II Amphibious Battlefield
January 27-February 25, 2023 // July 27-August 23, 2023
Measuring Elevation to Understand Coastal Change
Coastal elevation data allow scientists to document how the coastal environment is changing over time. At War in the Pacific National Historical Park (WAPA), such data is particularly important since past human activities, such as those related to World War II, and natural events, such as typhoons, have contributed to the current shape and structure of the coast. Understanding changes the park is now experiencing and may anticipate in the future due to climate change will help park managers identify the most effective management strategies for preserving its cultural and natural resources, both above the water and below it.
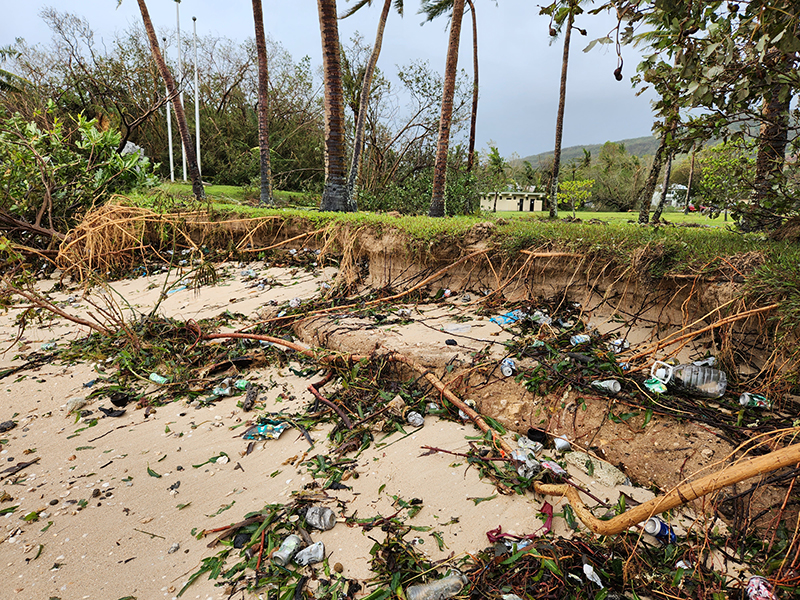
During our January/February 2023 field expedition, we conducted elevation surveys to map and characterize the coastal environment at the Asan and Agat units of WAPA. We repeated a subset of these surveys when we returned to Guam in May/June 2023. These datasets provide "snapshots in time" of the coastal environment, and we will compare them to each other to evaluate short-term change. This comparison will be especially meaningful because it will illustrate how Category 4 Typhoon Mawar, which made landfall on Guam on May 24, 2023, changed the coastline. Noticeable impacts from the storm included shoreline erosion, redistribution of sand along the beaches and intertidal zones, and reconfiguration of the Asan River mouth.
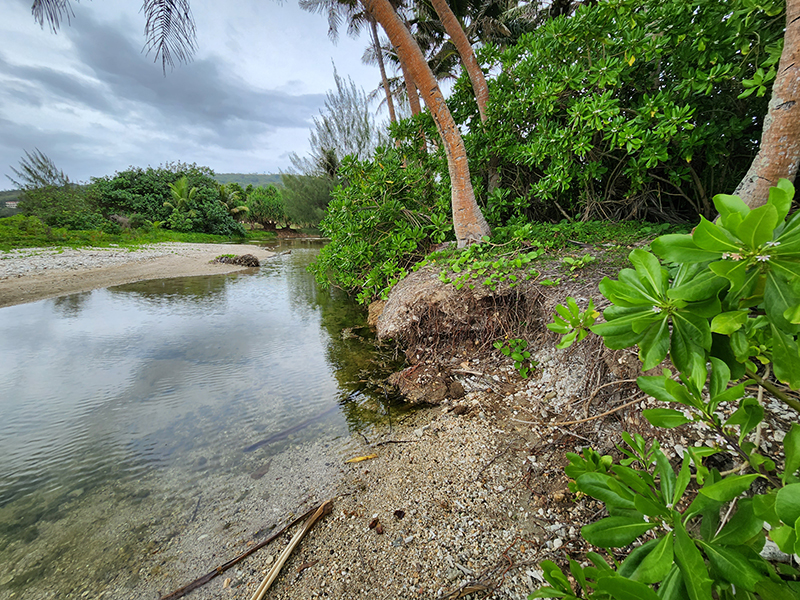
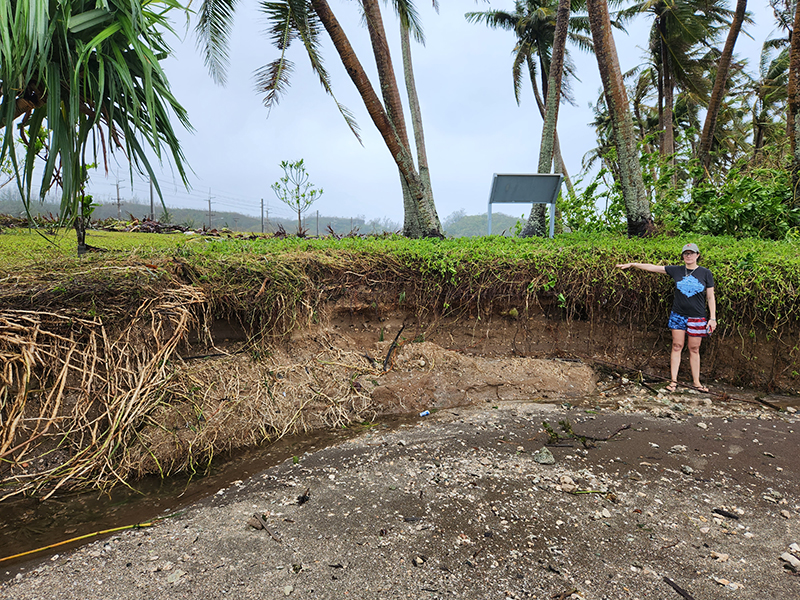
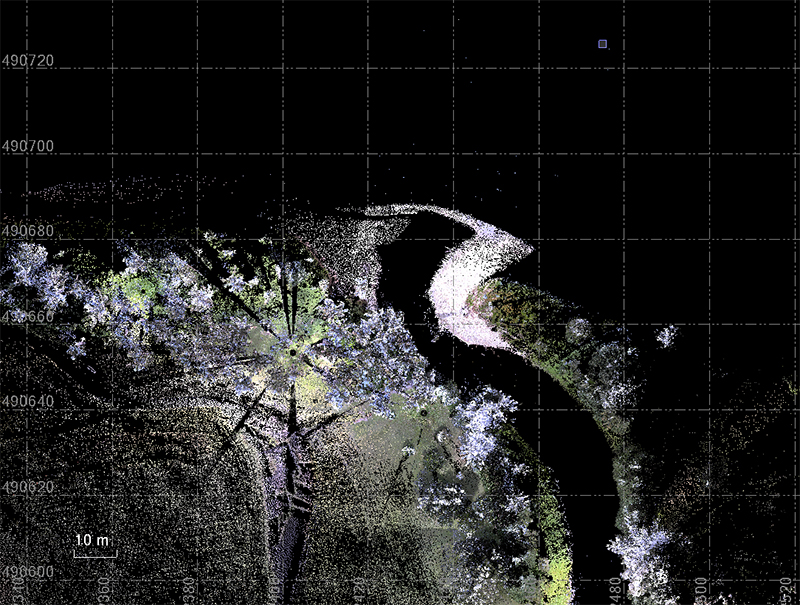
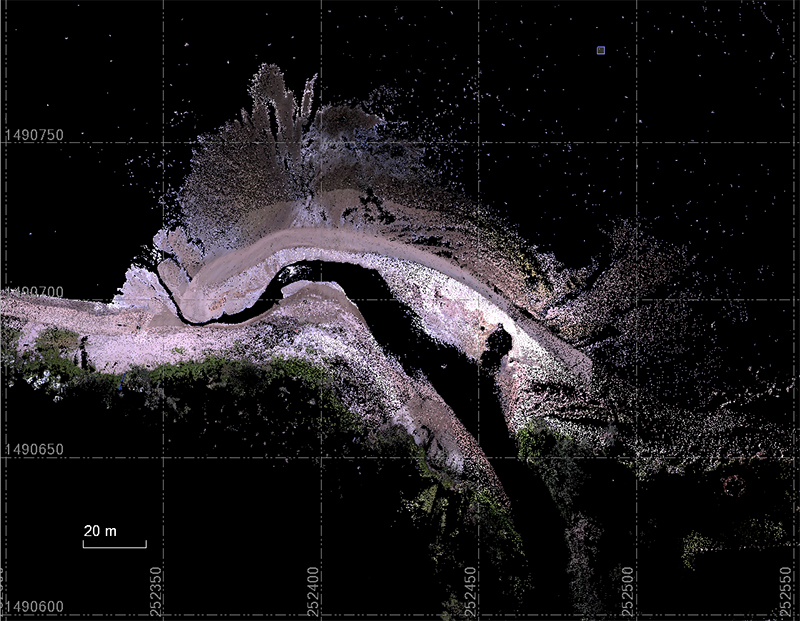
We collected elevation data using a Trimble SX10 scanning total station and R12i global navigation satellite system (GNSS) equipment. The scanning total station provides high-density point cloud data. The point clouds are x,y,z datasets, where x and y represent coordinates (e.g., latitude and longitude or easting and northing) and z represents elevation. These data can be turned into geospatial surfaces, such as digital elevation models (DEMs). We collected this data for the entire visitor use areas of both park units, from the shoreline to the main road, including the beach, intertidal zone, rivers, parking lots, and facilities.
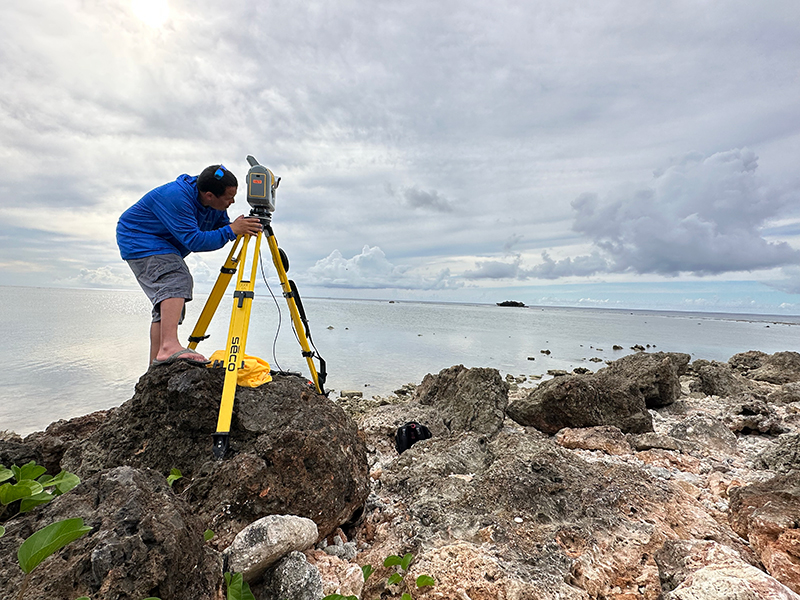
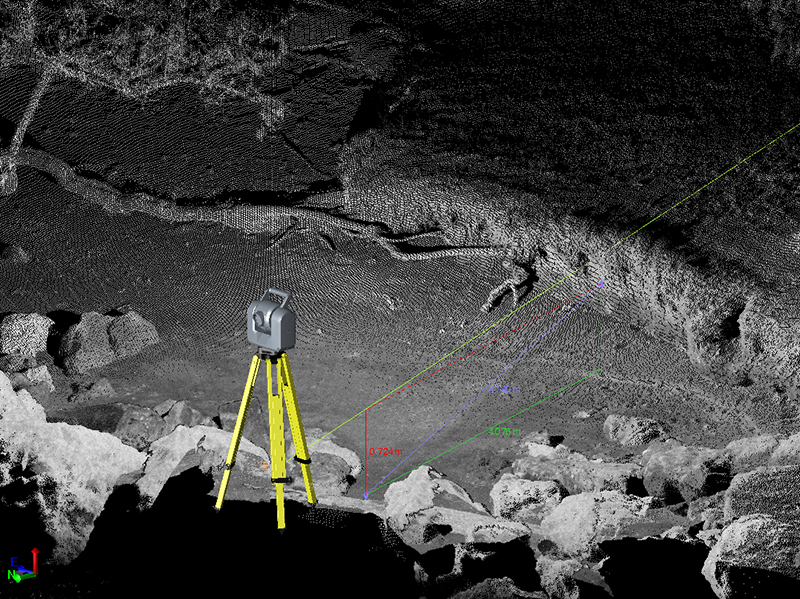
To complement the data from the scanning total station, we took thousands of measurements with the R12i GNSS receivers to document the location and elevation of specific features at each park unit. These features included the shoreline at low tide, shoreward bluff and vegetation lines, historic features (e.g., pill boxes, boulder wall), monuments, wayside signs, trails, parking bollards, and footprints of restroom facilities.
Collectively, these data will be used to provide a more holistic land-to-ocean understanding of the study areas, including insights of increased coastal vulnerability as a result of the blasting of the coral reefs during World War II.
By Monique LaFrance Bartley, National Park Service Ocean and Coastal Resources Branch
Published September 18, 2023