
By Colleen Peters, Senior Survey Technician
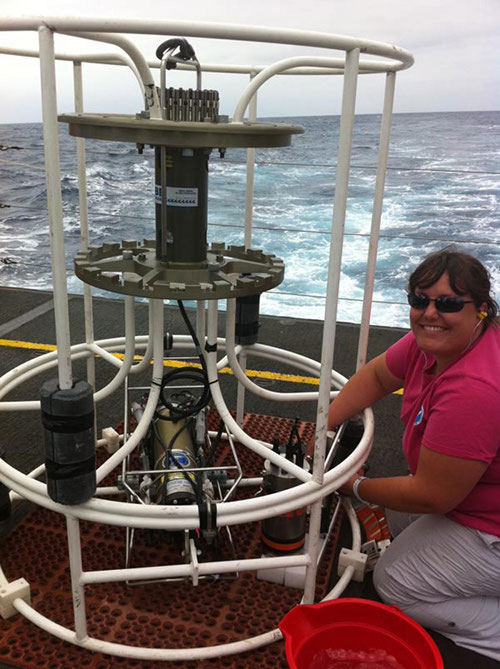
SST Peters installs the Altimeter and battery pack on the CTD frame in preparation for Tow-Yo operations. The altimeter measures the distance of the CTD package from the seafloor while it is near the bottom. Image courtesy of NOAA Office of Ocean Exploration and Research. Download larger version (jpg, 3.1 MB).
The Conductivity Temperature and Depth sensor package (CTD) is one tool of exploration used by the NOAA Ship Okeanos Explorer (EX). The first time I used a CTD was aboard the Schooner Westward (Sea Education Association) when I was enrolled in a summer programthat taught marine science along with seamanship and sailing. Since then, I have been interested in the things that we cannot necessarily ‘see’ in the ocean. CTDs are common equipment in oceanography because they measure chemical and physical properties of the water column, which serve as a foundation for understanding the marine environment. Combinations of temperature and salinity data are used to define water masses as part of the bigger picture of ocean circulation. Fish need particular combinations of temperature and salinity for normal biological routines, for example for reproduction. In exploration, we use CTDs for a variety of purposes, including acquiring sound velocity profiles of the water column to apply to the multibeam sonar data for accuracy of bathymetry measurements, and also, for detecting hydrothermal vents.
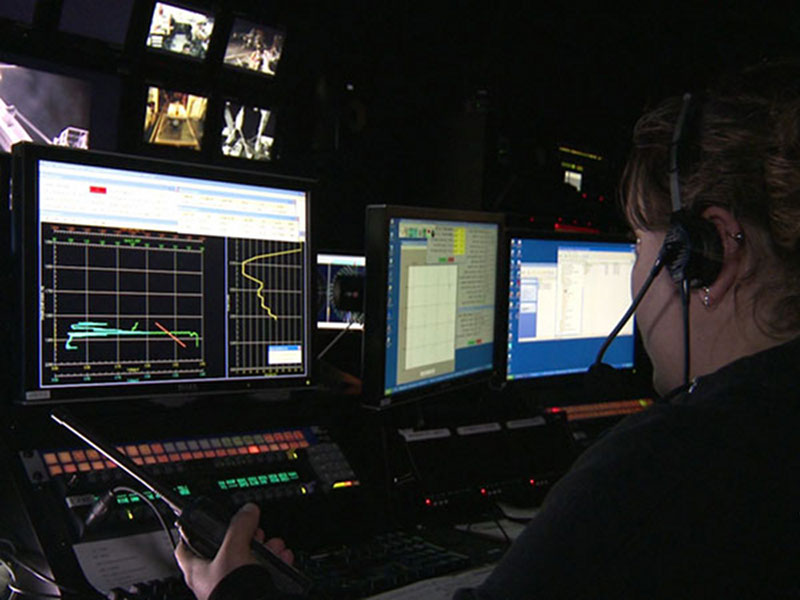
CTD monitoring crew. Image courtesy of NOAA Office of Ocean Exploration and Research. Download larger version (jpg, 752 KB).
We refer looking for hydrothermal vents as ‘sniffing’ because we cannot determine if hydrothermal activity is present solely based on bathymetry. Features that are likely locations of such activity can be mapped by the multibeam sonar, but then also need to be explored for certain chemical and physical signals with the CTD to determine if hydrothermal venting is present in the area. Once an area of activity is detected, we can pinpoint the source of the vent with additional CTD operations as necessary. Once we determine a more precise location, the underwater vehicles are then sent to the seafloor to get visual confirmation and high definition imagery of the site.
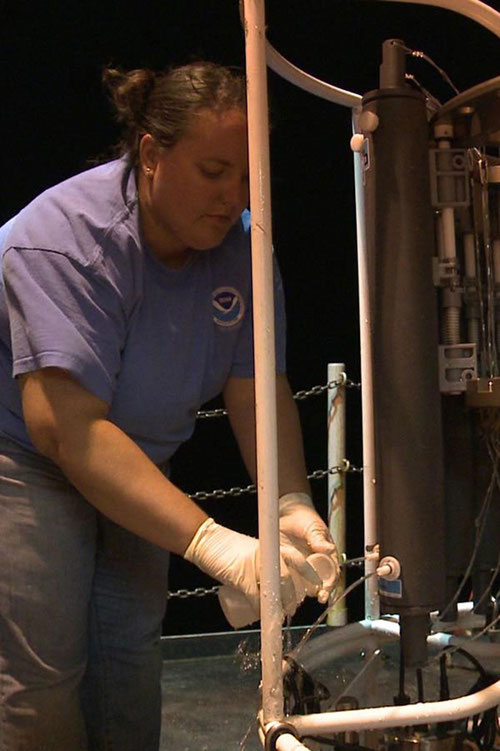
SST Peters collects water samples from a vertical cast conducted at the site of the strongest plume signal, shown in the data plot. Image courtesy of NOAA Office of Ocean Exploration and Research. Download larger version (jpg, 448 KB).
The CTD is most commonly deployed for vertical casts which produces a profile of the water column. A vertical cast can take anywhere from one to four hours to complete based on water depth and water sampling. It can be very time consuming to lower and raise the CTD through the entire water column. Instead, to ‘sniff’ along the seafloor for vents, we conduct an operation called a tow-yo. The CTD is lowered to within 20 meters of the seafloor, and then is cycled between near-bottom and 300 meters above the seafloor (like a huge yo-yo) as it is towed behind the ship at 1.5-1.7 knots. Sensor data is recorded and monitored continuously to look for signs that plumes from hydrothermal vents are present. By towing the CTD close to the seafloor rather than doing individual vertical casts, the CTD can cover more horizontal distance, and focus on the area of the water column in which plumes are generally located, within around 300 meters of the seafloor, or less as requested. The EX is equipped a particular set of sensors to sniff for vents: Oxidation Reduction Potential (ORP), Light Scattering Sensor (LSS) and an altimeter.
On Leg one, we conducted tow yos for six days in a row. During this time, we were able to locate several areas of hydrothermal activity. In conjunction with the multibeam bathymetry, these data sets were then utilized in dive site planning for the current leg. Additional tow yos have since been conducted to see if the plume is still around, but this time, the ‘yos’ were much closer together. The EX moved ahead at 0.5 knots and the yo was conducted between 20 and 120 meters above bottom. We did not cover as much horizontal distance, as we would by going the normal speed, but we were able to get a closer look at the intensity and spacial resolution of the plume with a denser data set to try and hone in on the vent source.
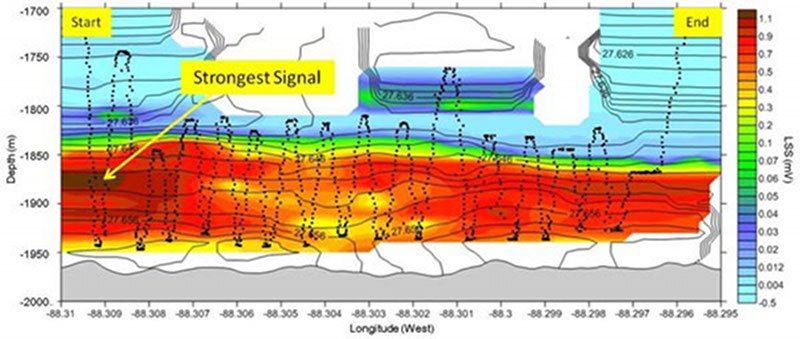
This is a plot of the data from Tow 02 on Leg 2. The x axis displays the longitude of the tow, the vertical axis is depth, and the shading along the tow is the Light Scattering Sensor data. The dark patch on the left (beginning of tow) is the strongest plume signal. Image courtesy of NOAA Office of Ocean Exploration and Research. Download larger version (jpg, 585 KB).
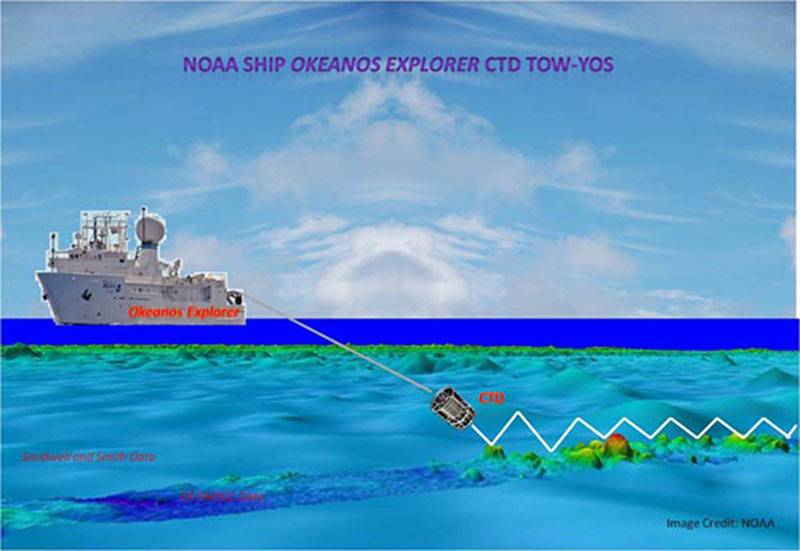
This image demonstrates the concept of a CTD Tow-Yo. Image courtesy of NOAA Office of Ocean Exploration and Research. Download larger version (jpg, 598 KB).
Without the CTD, trying to find vents would be like pinning up a printed map of the multibeam data and throwing darts at it. Although geological features that can indicate a vent field can be resolved by the multibeam, there is no other way to determine if the site is currently active or not without the CTD sensor data to detect the plumes. The ROV covers such a small area in one dive that it would be very difficult to find a vent without the plume information. With approximately 95% of the ocean unexplored… we’ve got a lot of ground to cover.