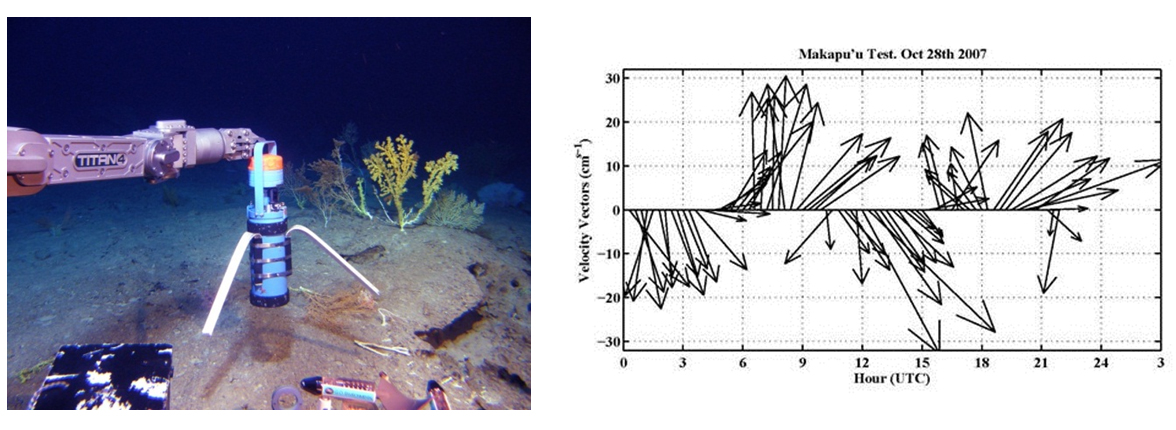
Figure 1. Photo: Acoustic current meter with particulate sensor and thermograph. Graph: A vector plot of the direction and flow intensity of the passing water over 24 hours.
