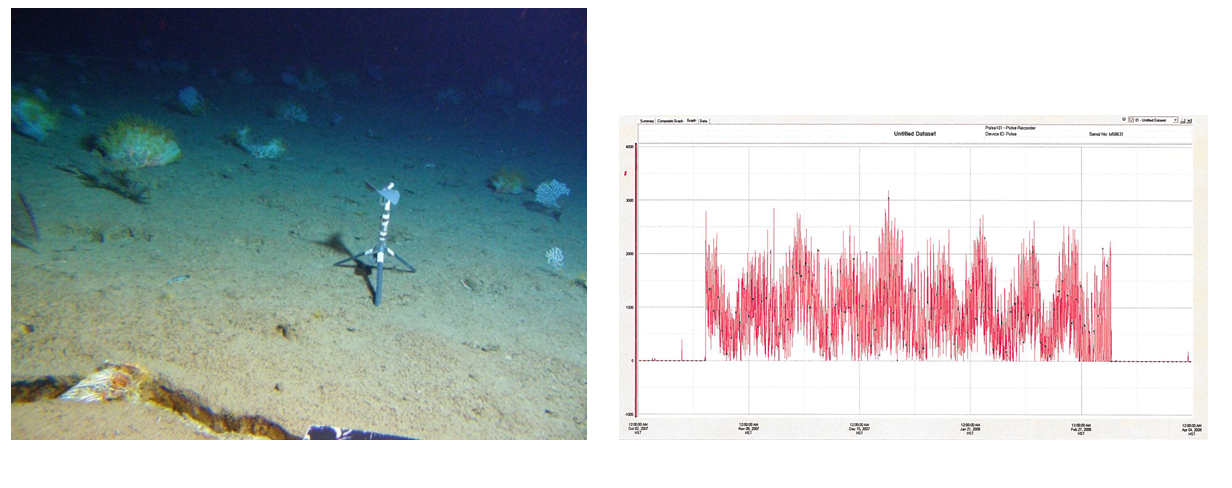
Figure 2. Photo: Flow meter with thermograph. Graph: Counts of impellor rotations showing tidal fluctuations in passing water flow over three months.
