
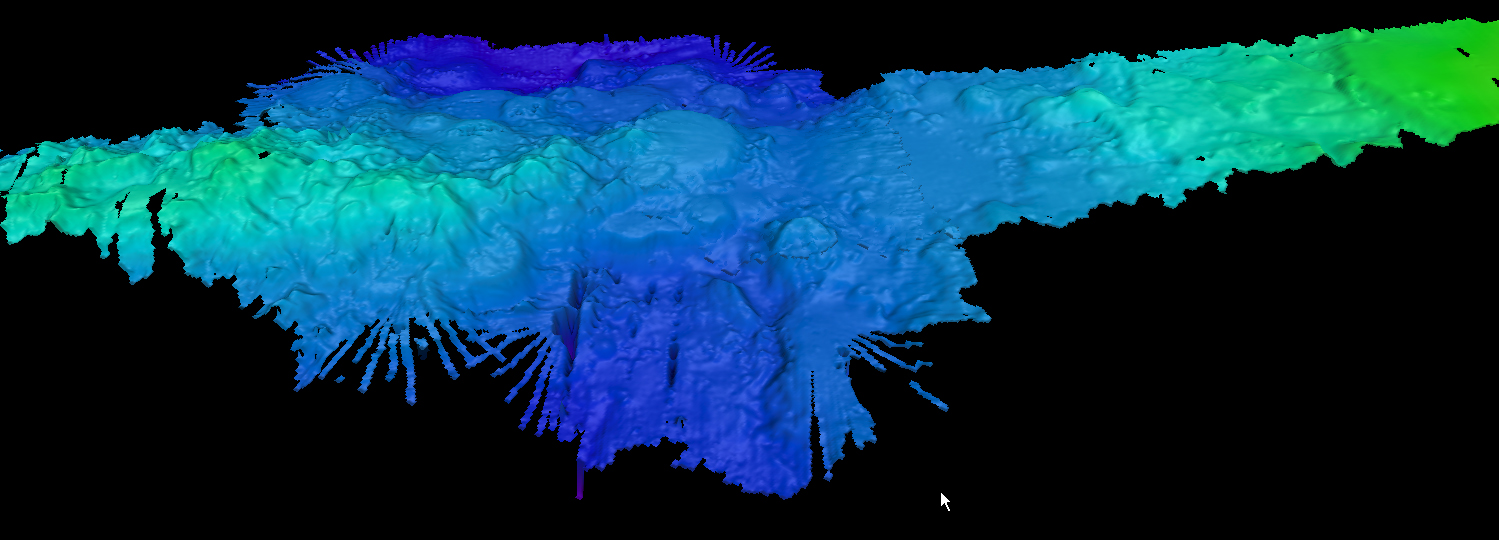
This saddle-like feature was mapped on May 1 between a unnamed seamount and ridge, just north of the Cook Islands. The area was previously unmapped, so this is the first time this feature has ever been revealed to humans in such detail. Data like these are important because they help scientists to understand the importance between ridge areas and plateaus, as well as the connection between this region and others. Image courtesy of the NOAA Office of Ocean Exploration and Research, Mountains in the Deep: Exploring the Central Pacific Basin. Download larger version (jpg, 390 KB).

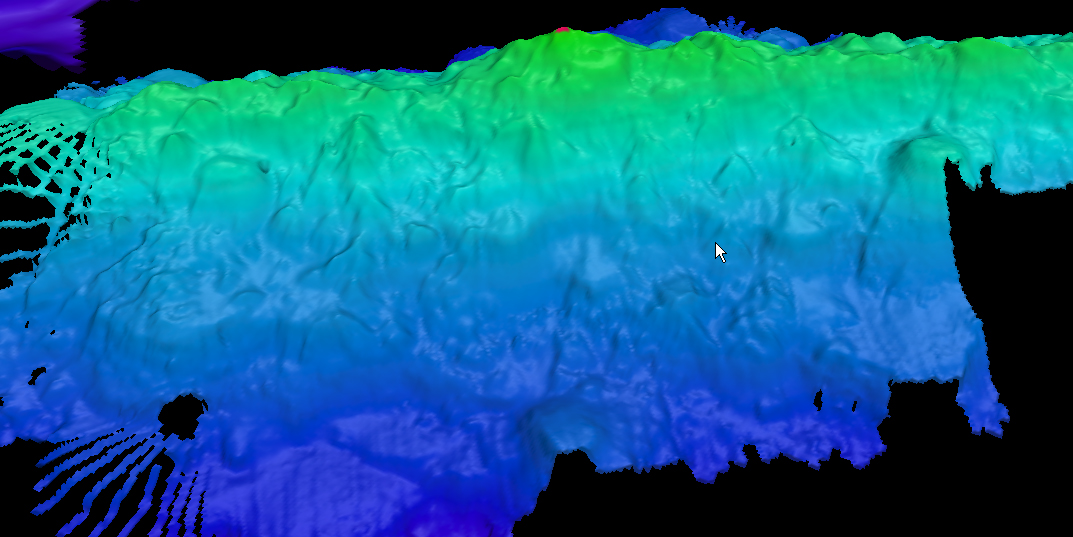
Altimetry data informed us that this ridge feature existed and we selected it as a target for high-resolution bathymetric mapping. Much to our surprise, the ridge turned out to be over a full kilometer higher than previously thought. This is one of the many reasons that high-resolution bathymetry mapping is so important — it allows us to better understand our planet. Image courtesy of the NOAA Office of Ocean Exploration and Research, Mountains in the Deep: Exploring the Central Pacific Basin. Download larger version (jpg, 352 KB).