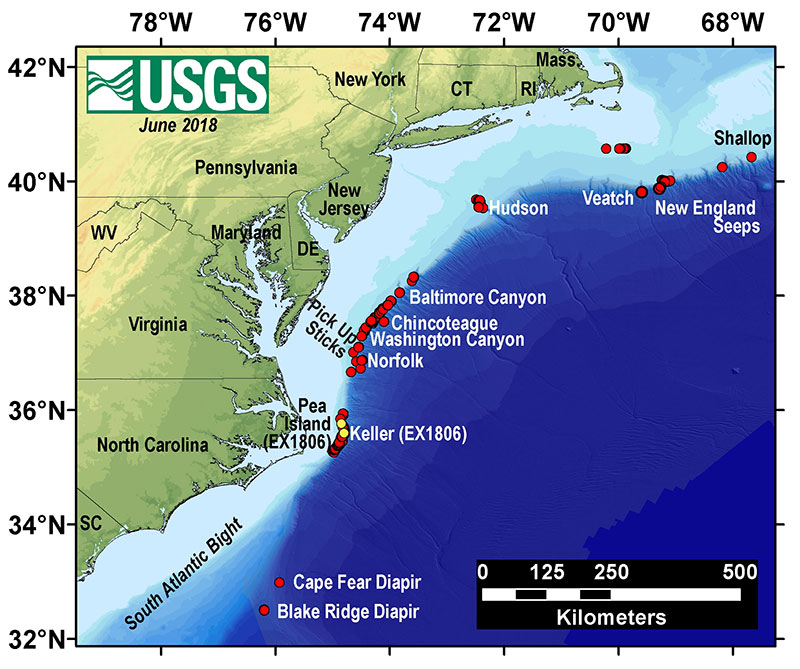
The red circles represent methane seep from the database of Skarke et al. (2014) based on NOAA Office of Ocean Exploration and Research surveys, with updates (many additions and a few deletions) based on geophysical surveys by the U.S. Geological Survey (USGS) Gas Hydrates Project in 2016 and 2017. Labelled seeps have been surveyed during ROV or deep submergence vehicle (DSV)<em> Alvin</em> dives since 2001, with most dives carried out since 2012 (compilation by C. Ruppel, pers. comm.). The yellow circles indicate the locations of seeps targeted for <em>Deep Discoverer</em> dives on NOAA Ship <em>Okeanos Explorer</em> Windows to the Deep 2018 expedition (EX1806).
Map of Seeps
Detailed bathymetry on the upper continental slope from Andrews et al. (2016). Image courtesy of Carolyn Ruppel, USGS. Download larger version (jpg, 1.7 MB).
The red circles represent methane seep from the database of Skarke et al.  (2014) based on NOAA Office of Ocean Exploration and Research surveys, with updates (many additions and a few deletions) based on geophysical surveys by the U.S. Geological Survey (USGS) Gas Hydrates Project in 2016 and 2017. Labelled seeps have been surveyed during ROV or deep submergence vehicle (DSV) Alvin dives since 2001, with most dives carried out since 2012 (compilation by C. Ruppel, pers. comm.). The yellow circles indicate the locations of seeps targeted for Deep Discoverer dives on NOAA Ship Okeanos Explorer Windows to the Deep 2018 expedition (EX1806).
Learn more