 to 1,000 meters (bottom of the image) over time (from left to right on the image). Higher backscatter is shown in green, to yellow and red. Lower levels are in blue and black. The pattern of vertical migration is reflected in the undulating pattern in the high backscatter.")
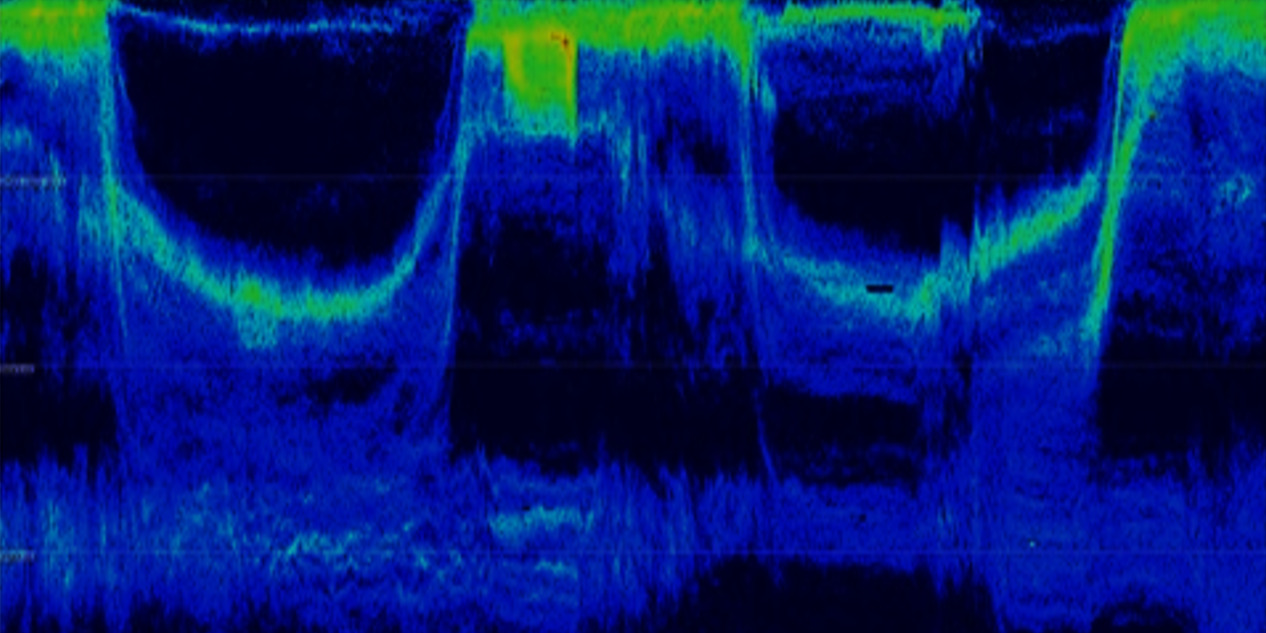
Image from an echogram showing backscatter from the water column from the surface (at the top of the image) to 1,000 meters (bottom of the image) over time (from left to right on the image). Higher backscatter is shown in green, to yellow and red. Lower levels are in blue and black. The pattern of vertical migration is reflected in the undulating pattern in the high backscatter.