
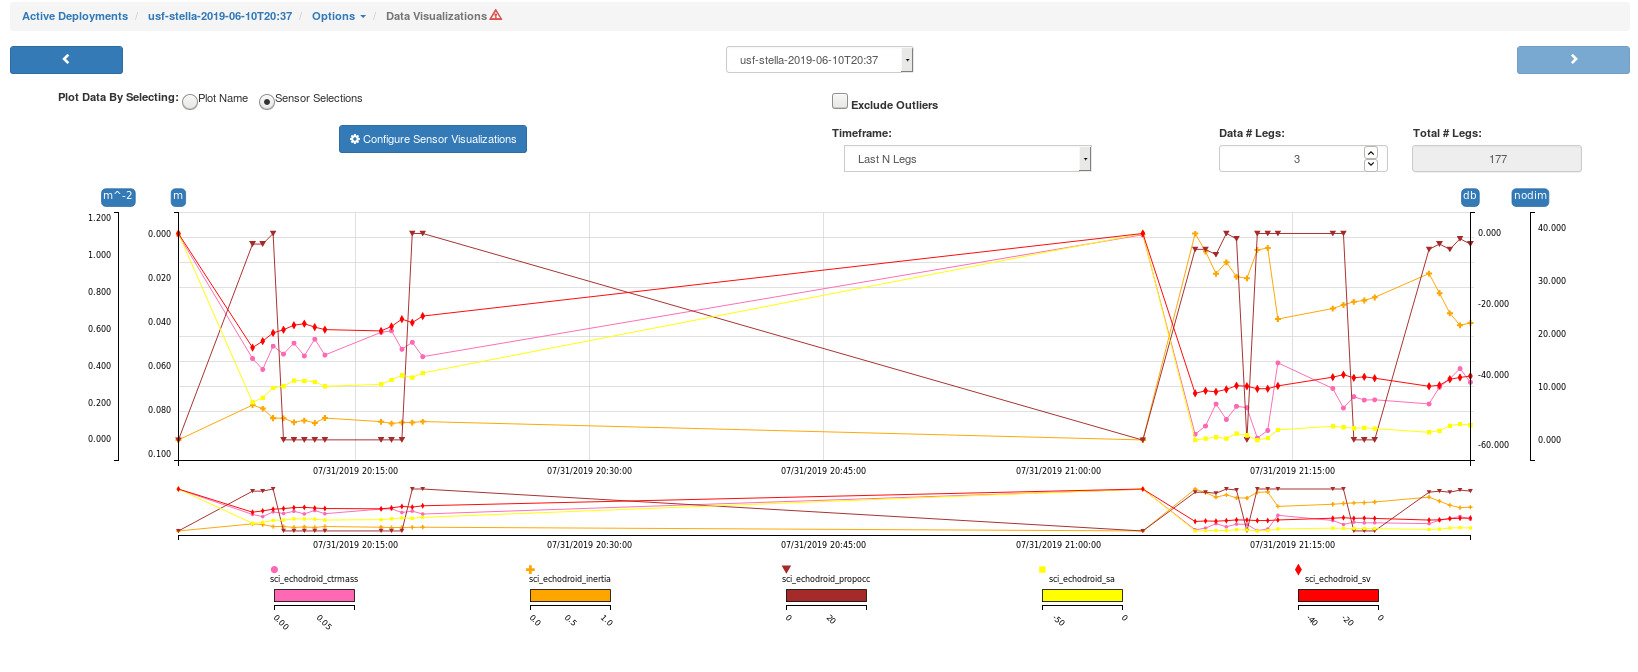
Screenshot of the glider mission control software showing individually colored plots of “Echometric” values through two dives. The x-axis represents time and the y-axes represent scales for each metric plotted. The echosounder collects data during dive descents, so values are shown until the end of one dive and then the plots jump to the start of the next dive. In the figure the first descent occurs during the first quarter of the graph. The second dive starts after the ascent and is located in the final quarter of the graph.