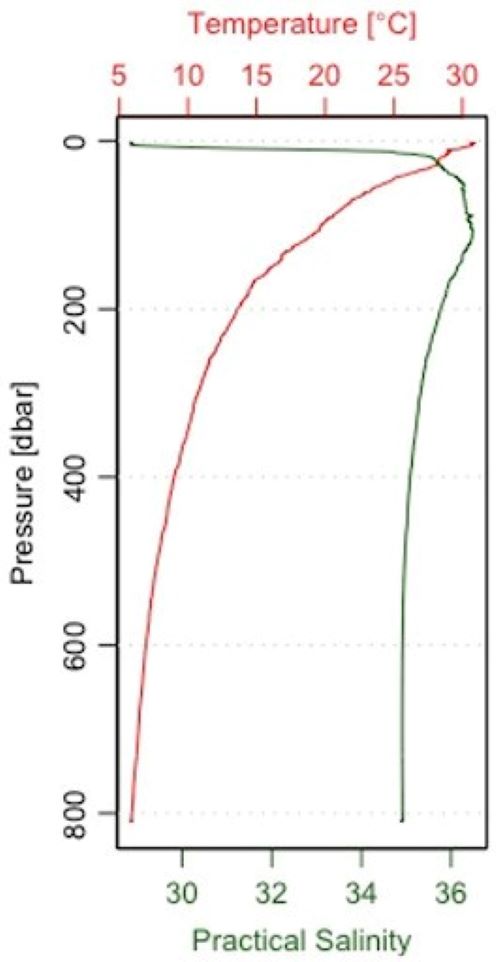
 and matches the high-nutrient, productive waters (i.e., greater amounts of Chlorophyll a) being pushed offshore from the Mississippi River. The green line represents practical salinity, the red line represents temperature, and the y-axis is a measure of depth.")
Figure 5. Water column profile of temperature and salinity at 29N, 87.6 W, where the water column exhibited a strong change in salinity in the upper 50 meters (164 feet) and matches the high-nutrient, productive waters (i.e., greater amounts of Chlorophyll a) being pushed offshore from the Mississippi River. The green line represents practical salinity, the red line represents temperature, and the y-axis is a measure of depth.