by Mike Annis, Rob Downs, Lt John Kidd, and Alex Ligon
NOAA's Office of Coast Survey
July 25, 2019

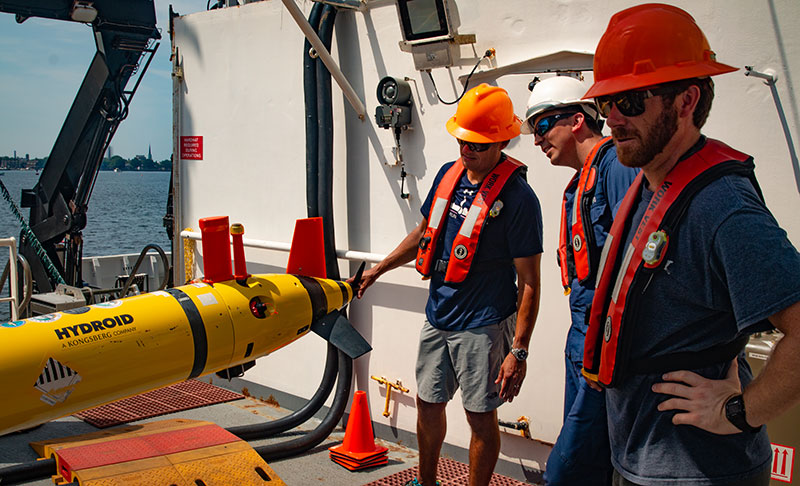
Alex Ligon, Lt John Kidd, and Mike Annis of NOAA's Office of Coast Survey plan how to launch and recover the REMUS 600 AUV while the Okeanos Explorer is pierside in Norfolk, Virginia. Image courtesy of the NOAA Office of Ocean Exploration and Research, 2019 Technology Demonstration. Download larger version (jpg, 3.6 MB).
Autonomous underwater vehicles (AUVs) are self-propelled, untethered systems that can follow pre-programmed survey instructions without operator intervention. NOAA’s Office of Coast Survey uses both small and midsized AUVs to complement conventionally staffed survey and research vessels to conduct seafloor mapping surveys in support of navigation safety and NOAA science.
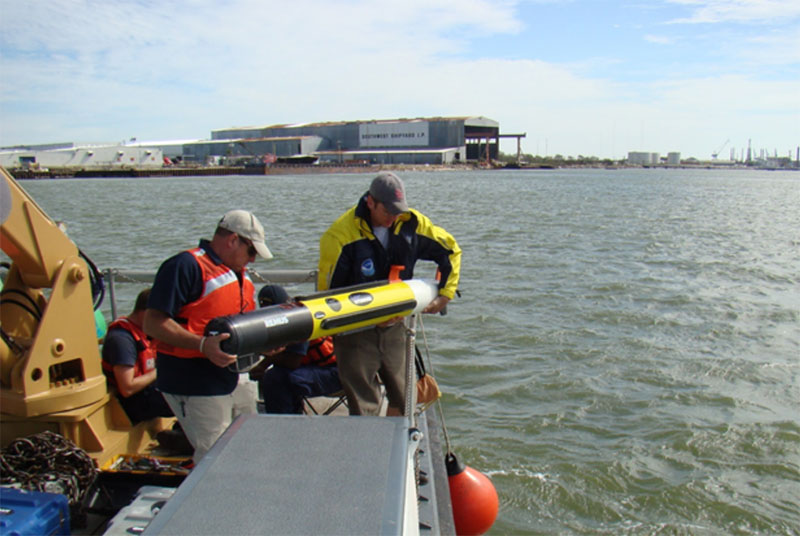
Small AUVs equipped with side scan imaging sonar are used to identify submerged hazards to navigation and enhance Coast Survey’s response capabilities. These systems can be operated from shore or small boats with minimal equipment setup and can survey without supervision, which can free the host vessel to perform additional surveys or other necessary work to reopen a port.

Coast Survey’s Hydroid REMUS 100 AUV being deployed from a Coast Guard vessel in Galveston Harbor during a response survey following Hurricane Ike. Image courtesy of NOAA's Office of Coast Survey. Download larger version (jpg, 370 KB).
Midsized AUVs, such as the REMUS 600 deployed on NOAA Ship Okeanos Explorer during the 2019 Technology Demonstration, that are equipped with multibeam bathymetric sonar can collect high-resolution seafloor mapping data in greater depths than possible with shipboard systems. This capability makes Coast Survey’s mid-sized AUV well suited for interdisciplinary seafloor mapping missions in support of a broad range of NOAA science, including habitat characterization, coral assessment, and marine archaeology.
Coast Survey’s REMUS 600 AUV can survey for over 20 hours at depths up to 450 meters (~1,475 feet), which provides high-resolution mapping capabilities to depths of 525 meters (~1,720 feet). The AUV is positioned on the surface with GPS to aid navigation using an Inertial Navigation System (INS), which tightly integrates input from multiple sensors to position the AUV while submerged. The AUV is typically programmed to “fly” 25 to 50 meters (~82-164 feet) above the seafloor and surface periodically to update the GPS position and transmit status to the host ship via a satellite modem connection. The AUV is also capable of acoustic communications with the host ship at ranges up to 2 kilometers (~1.2 miles) when submerged and wireless Ethernet up to 1,000 meters (3,280 feet) when surfaced. When the AUV completes its planned survey mission, it holds position at depth until it is called to the surface for recovery.

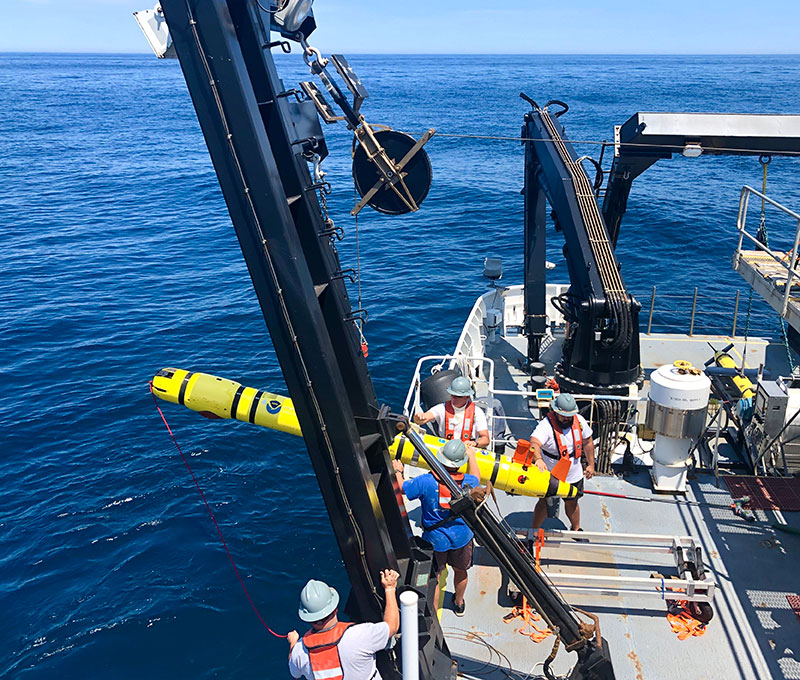
AB Peter Brill, AB Chris Remaley, GVA Sidney Dunn, and Acting CB Michael Collins recover the REMUS 600 using the J-frame on the CTD deck of the Okeanos Explorer. Image courtesy of Charlie Wilkins. Download larger version (jpg, 370 KB).
Following each mission, AUV log files and sensor data are downloaded via a high-speed data cable, the AUV batteries are charged, and the next mission program is uploaded to the AUV. During the expedition on the Okeanos Explorer, the REMUS 600 AUV was sent on three missions, ranging from 5 to 10 hours in depths averaging 90 meters (295 feet).
The Remus 600 collects data in the standard Kongsberg .all format, as well as data from the on board INS, pressure sensor, and sound velocity sensor. After the vehicle is recovered and all data are transferred, the INS and sensor data are post processed using Kongsberg’s NavLab software. The vehicle’s sensor data and .all bathymetric data files are combined to produce highly accurate depths.

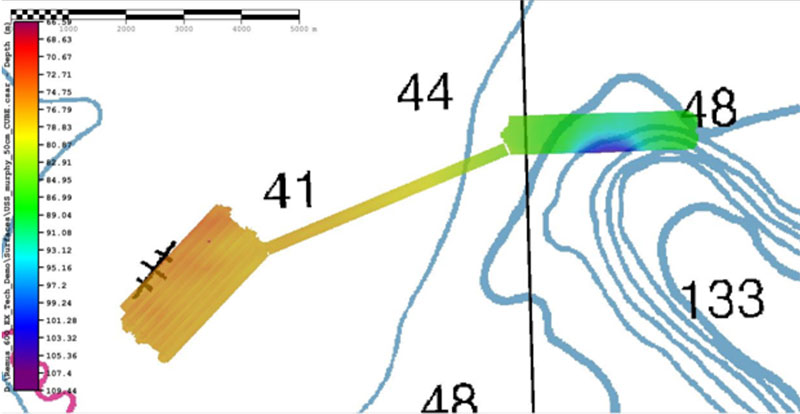
EM3002 multibeam bathymetry collected over the head of Hudson Canyon on the 2019 Technology Demonstration cruise, overlaid on the NOAA nautical chart. Image courtesy of NOAA's Office of Coast Survey and the NOAA Office of Ocean Exploration and Research. Download larger version (jpg, 176 KB).