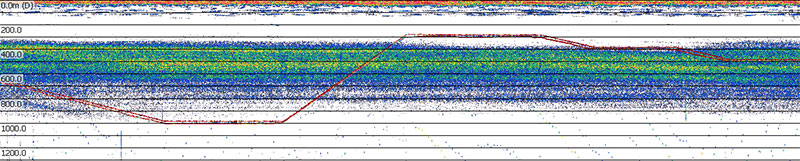
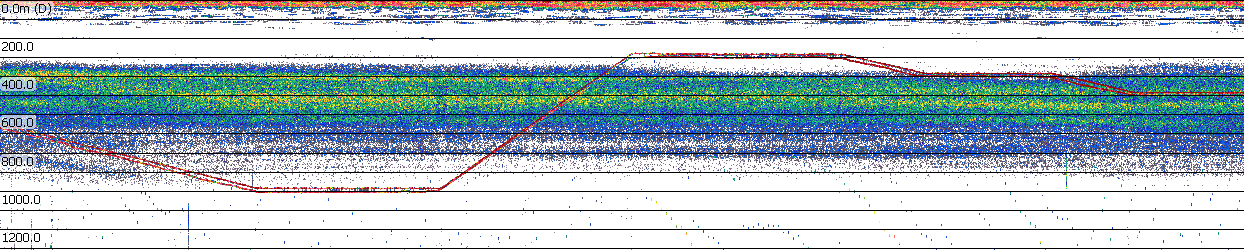
This is an example of what the deep-scattering layer looks like when graphed as an echogram, which is a plot of active acoustic data. Warmer colors indicate more backscatter, meaning that more (or stronger) echoes were received back from the organisms at that depth. The red line indicates the remotely operated vehicle trajectory as it performs transects throughout the layer. The scale on the left represents depth in meters.