


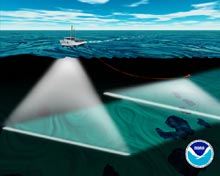
Illustration of a ship using multibeam sonar to map the seafloor in a swath below the ship as it drives forward. Click image for larger view.
2005 Sea-floor Mapping
Bill Chadwick
Oregon State University
NOAA Vents Program
In order to “see” volcanoes that are entirely underwater we use a variety of sonar data to make bathymetric maps and three-dimensional images of the seafloor. Their value as exploration tools is that they allow us to view the shape and texture of the seafloor, identify key areas that we want to study in more detail, and allow us to place submersible observations into a meaningful context. Multibeam sonars mounted on ships can map large areas of the seafloor, whereas scanning sonars mounted on submersibles provide much higher resolution views of small study areas.
Multibeam sonars work by simultaneously sending out multiple sonar beams in a fan-shaped pattern that is oriented perpendicular to the ship's track. In this way, the seafloor to either side of the ship can be mapped at the same time as the area directly below. The ship can drive forward at ~9 knots while mapping and the sonar swath width is about 3 times the water depth, making multibeam mapping very efficient. In contrast, the down-looking scanning sonar on the submersible uses one sonar beam that sweeps back and forth from side to side while ranging to the bottom. Because the submersible is much closer to the seafloor than the ship at the surface, the data it collects show much more detail over a smaller area (2 meter pixels vs. 35 meter pixels). Computers on board the ship are used to process both kinds of sonar data and to make two or three-dimensional maps that help to visualize features on the seafloor.
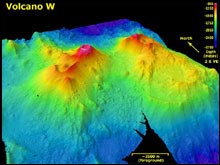
Three-dimensional view of Volcano W, viewed from the southwest looking to the northeast. Depths range from 840 to 2700 meters (2755 - 8850 feet). The resolution of the bathymetry data is 25 meters. The image is two times vertically exaggerated. The centers of the two main cones are ~ 5 kilometers (> 2.5 nautical miles) apart. The bathymetry data are courtesy of New Zealand National Institute of Water and Atmospheric Research (NIWA). Click image for larger view.
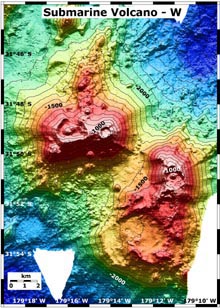
Two-dimensional map view of submarine Volcano-W. The contour interval is 100 meters. The resolution of the bathymetry data is 25 meters. The bathymetry data are provided courtesy of New Zealand National Institute of Water and Atmospheric Research (NIWA). Click image for a larger view.
The New Zealand-American Submarine Ring of Fire 2005 expedition will rely heavily on multibeam sonar data that was collected during previous expeditions to the Kermadec volcanic arc over the last few years. Maps of each volcano will be used to plan and carry out dives with the PISCES submersible. Our goal is to explore the active submarine volcanoes of the Kermadec Arc, but in order to do that we have to know where they are, how deep they are, and what they look like. The maps give clues about the character and history of each volcano, where hydrothermal vents might be located, and may reveal enigmatic features that call for closer examination. Maps of the seafloor also provide a physical context for near-bottom observations made during submersible dives. They show the broader submarine landscape beyond what is visible from the lights of the submarine.
For an excellent review of the history of seafloor mapping, please see the 2003 Submarine Ring of Fire Seafloor Mapping essay.