


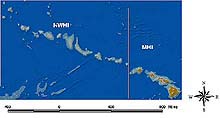
A shaded relief image of the Main (MHI) and Northwestern (NWHI) Hawaiian Islands. The data comprising this image are a compilation of various bathymetric and topographic datasets. The lighter colors represent shallower water. The brownish color delineates emergent land areas. Click image for larger view.
Mapping the Bathymetry of the Northwestern Hawaiian Islands – Why, How, and How Was It Done Before?
John R. Smith
Marine Geophysical Specialist
Hawai`i Undersea Research Laboratory
Why is mapping the Northwestern Hawaiian Islands important?
The Northwestern Hawaiian Islands stretch 1,200 nautical miles (nm), or over 2,200 km, to the northwest of the 420-nm-long (775 km) Main, or Southeast, Hawaiian Islands. Only in recent years have the main islands been systematically mapped with modern multibeam swath sonar systems, and the work is not yet complete. With the southeastern islands being the population center, it is easy to understand the lack of coverage of the northwest chain, where no one lives except those stationed at remote outposts for scientific study. What is incredible is that this large expanse is longer than the State of California.
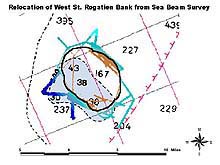
SeaBeam survey of West St. Rogatien Bank overlaid on a nautical chart with depth chart soundings (large numbers) in fathoms. The location shown on the chart (light blue area surrounded by dashed black line) is approximately two nautical miles southwest of the true location (thick black line). The thick black line is an interpretation of the location of the 100 fathom contour based on the color coding of the SeaBeam data (100 fathoms lies between the brown and blue color change). Click image for larger view.
The recent establishment of the Northwestern Hawaiian Islands Coral Reef Ecosystem Reserve (NWHICRER) has caused an infusion of interest and funds for studies to assess what is there to preserve and how best to do it. In planning a "road trip" vacation, one of the first things one does is to find a map of the route and attractions to see. In this case, however, no such detailed maps exist at the local travel agency. There are nautical charts that mariners use to navigate through these islands, reefs, and atolls, but it has been noted over the past few years that some of the features are mislocated. This is due mainly to the errors involved with previous navigation techniques in remote areas. Now, the Global Positioning System (GPS) of satellites allows accurate positioning to within meters virtually anywhere on the planet.
How was mapping done in the past and how has the technique improved?
Sea floor mapping technology has improved greatly over time. While the initial depth soundings may have indeed been accurate, they were limited in number, and thus, coverage between single soundings was lacking. In the beginning years of hydrography, “lead lines” were used to measure water depth, and celestial navigation techniques, using various styles of sextants, were employed to locate the soundings. Lead lines were ropes, or lines, with depth markings and lead weights attached that were lowered and read manually, a labor-intensive and time-consuming process. Next came single-beam echo sounders that could measure a single water depth per sonar ping, greatly speeding the survey process and allowing more data points to be collected. With the advent of modern multibeam swath mapping systems, 100% of the sea floor could be mapped efficiently with improved detail because of advances in acoustic beam-forming technology. These systems have continued to improve in quality and coverage since their introduction in the 1970s.
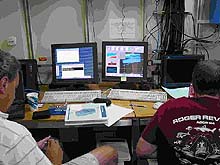
Operator station for the shallow and deep-water Simrad multibeam sonar systems. All system operation occurs through computer interface. The screens show various data quality control displays to insure adequate seafloor coverage in near real time. Click image for larger view.
Along with bathymetric data that allows the construction of sea floor topographic (elevation) maps, it is possible to extract backscatter (sidescan) information that shows acoustic texture by the strength of sonar signal reflections, or “returns.” This imagery is analogous to an air or satellite photograph, only in this case, it is the reflection of sound, rather than light that the “camera” (transducer) sees. This data is useful for determining if the system is mapping mud, sand, coral reef, or volcanic material, and during interpretation, one can identify features such as geologic faults and fissures, lava flows, and rocky outcrops that may be good fish habitat areas. The backscatter imagery can be digitally “draped” on the bathymetry terrain model for a most effective presentation and useful product.
Sign up for the Ocean Explorer E-mail Update List.