


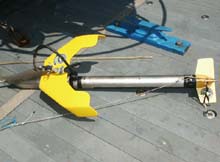
Coastal Carolina University’s side scan sonar tow vehicle. This ‘fish’ works at a frequency of 100 KHz. Click image for larger view.
Side Scan Sonar at the Edge
July 31, 2002
German Y. Ojeda
Center for Marine and Wetland Studies, Coastal Carolina University
Charlie Barans
South Carolina Department of Natural Resources
Jeremy Potter
NOAA Ocean Exploration
Hard-bottom areas, which provide habitat for many species of reef fish, are of critical importance to recreational and commercial fishing communities. The first leg of Islands in the Stream 2002 is using side scan sonar technology to search for hard-bottom areas of the seafloor with high vertical relief.
What is Side Scan Sonar?
Here is your dilemma. You left your car keys somewhere in the middle of a huge pitch-black gymnasium. You have to find them quickly to catch your flight to Hawaii for a long-awaited vacation. Unfortunately, the lights are not working. If you stumble around in the darkness seeing only what is right in front of your eyes, you will eventually find them, but chances are that you will miss your flight. What can you do? Your only hope may be the small flashlight in your pocket. You probably still won’t find your keys immediately, but with the flashlight you can cover a much greater area in a shorter period of time.
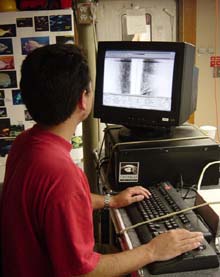
Side scan sonar acquisition computer. Incoming data scrolls continually on the screen as it is collected. Click image for larger view.
Now, instead of a gymnasium, you are interested in searching the seafloor. Side scan sonar is the equivalent of the flashlight. However, there is one very important difference. Instead of using light to see the bottom, side scan sonar uses sound waves. Much like carpenters tapping on a wall in a house to find studs, fisheries biologists and marine geologists use sound to infer information about the structure and composition of the seafloor. Imaging the seafloor can be used in a variety of applications to assist scientists, resource managers, and the public.
The main components of a side scan sonar system are:
1) the tow-vehicle or "fish"—an electrical device towed behind a moving ship that sends and receives the acoustic signals;
2) a computer, located inside the ship that controls the flow of information and stores all of the data; and
3) a cable, connecting the computer to the "fish" which transmits the acoustic information.
Because side scan sonar does not require sunlight, data are often collected at night and used to target the location of the submersible dives the following day. Compared to submersible observations, side scan sonar data not only is much less expensive, but it also covers a much larger area of the seafloor. Consequently, scientists can use the side scan sonar in advance to select the areas where direct submersible observations are needed. Without this information, scientists could spend precious submersible time traveling over areas that are of little interest to this mission.
Beyond targeting submersible dives, side scan information can be used for a variety of scientific purposes. For example, these data can be used to characterize the roughness and type of bottom, e.g., whether it is sandy, muddy or rocky. Also, sonar data can provide hints regarding the types of fishes and invertebrates that may live there. Though side scan sonar alone is not designed to measure ocean bathymetry (depth), when combined with a depth-measuring device (such as a fathometer”), it becomes a more powerful tool that can improve our understanding of benthic environments.
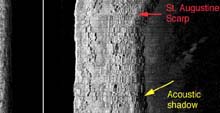
Raw side scan sonar record of the St. Augustine Scarp. The acoustic shadow outlines bottom-relief along the St. Augustine Scarp, which runs from top to bottom on the screen immediately left of the shadow. Click image for larger view.
Side scan sonar imagery, in addition to biological and geological information collected on this mission, will be made available to resource management agencies and the public. This information will be relevant to future designation of proposed marine protected areas (MPAs) in the South Atlantic Bight region. Because information regarding hard-bottoms in this region is so limited, maps derived from data collection during this mission will be extremely valuable to decisionmakers. Though the scientific products of Islands in the Stream 2002 are sure to play an important role in the decision-making process, a variety of other factors, including potential socioeconomic effects, will be considered.
New technologies continue to be developed that will enhance the maps of the seafloor produced from sonar data. After this mission, scientists from Coastal Carolina University will use spatially quantitative methods to improve the habitat classification from sonar images.
Side Scan Sonar Data Collection
July 28: St Augustine Scarp
Our target on July 28th was the St. Augustine Scarp. Historical records indicated that the scarp extended on a predominantly NNE-SSW direction for more than five miles. Coastal Carolina University’s sonar fish was deployed off the stern (back) of the R/V Seward Johnson at about 9:00 p.m. ET. Seas were at 1 to 2 ft. Although the fish was targeted to ‘fly’ some 20 meters off the bottom during data acquisition, submarine currents prevented it from descending any closer than 30 m from the bottom. Ship speed was constant at about 3.5 knots.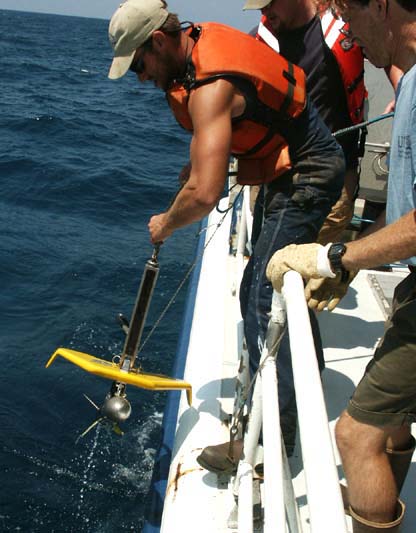
Deployment of the sonar fish off the stern of the R/V Seward Johnson. To prevent the fish from sinking vertically and hitting the bottom, the ship needs to be moving forward at the time of deployment. Click image for larger view.
After only a few minutes, acoustic shadows, produced when high-relief features of the bottom deflect sonar waves, appeared on the computer monitor. When a narrow, long, linear feature, which is characteristic of scarp geometry, began to appear on the computer monitor, we knew we had found the St. Augustine Scarp. After one and a half hours, we had collected 270 Megabytes of side scan sonar data. After the expedition, this data will be processed at the Center for Marine and Wetland Studies to produce a map of the St. Augustine Scarp.
July 31: Julian’s Ridge Scarp
Though we originally planned two submersible dives for today, three to six-foot seas this morning made JSL II launch and recovery too risky to attempt. Since the side scan sonar vehicle can be towed in waters deeper than the field of wave action, it presented a good alternative to the more weather-sensitive operations. At 9:10 am, the geophysical crew deployed the sonar tow fish along the first of five north-south track lines. Although wave-induced noise prevented them from collecting good-quality data along the first line, the remaining lines showed increased data quality, consistent with a gradual improvement of weather conditions. We imaged several interesting features on the seafloor, some of which suggest high-relief hard bottom areas, critical for the development of sessile benthic habitat.
Sign up for the Ocean Explorer E-mail Update List.