


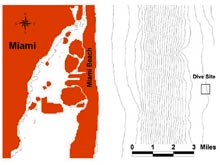
Figure 1: A map of Miami Sinkhole dive site and its location off Miami Beach, Florida. Each line represents a 10 meter contour. The bathymetric contour data was derived from the NOAA Coastal Data Model. Click image for larger view and image credit.
Search For Bumps And Pits On The Bottom
November 16, 2005
Will Schroeder, Ph.D.
Professor, Marine Science
Senior Marine Scientist
University of Alabama/Dauphin Island Sea Lab
Doug Weaver
Research/GIS Specialist
Flower Garden Banks National Marine Sanctuary
![]() View
video footage of scientist during the launch and first 207 feet of deployment of the Johnson-Sea-Link sub. (Quicktime,
1.1 Mb.)
View
video footage of scientist during the launch and first 207 feet of deployment of the Johnson-Sea-Link sub. (Quicktime,
1.1 Mb.)
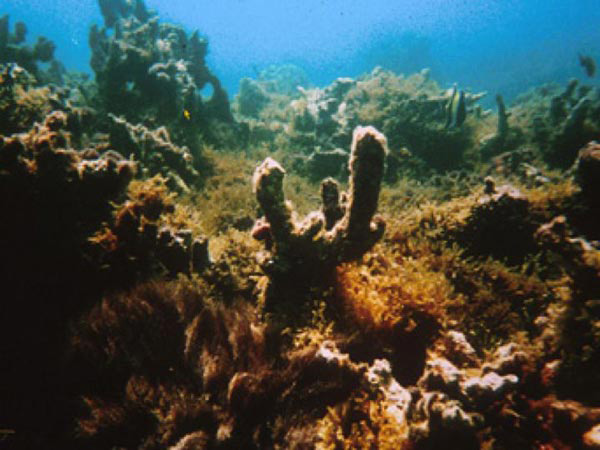
Not all scientists who study the deep sea are interested in "bumps and holes on the bottom," but all aboard the R/V Seward Johnson on this expedition are. Why is that? The answer is very simple. Bumps and sinkholes on the bottom are great places to look for hard (rock) surfaces that deep sea corals can grow on. This in turn provides habitat for a diversity of associated marine animals. These "bumps" could be low- to moderate-relief hills or ridges, small knolls, stair step-like terraces, rounded or flat-topped mounds, or tall pinnacles with steep sides. Sinkholes of varying sizes also occur off the southeast coast of Florida.
We begin our bump and sinkhole search with pre-dive surveys at known target sites. These sites may be identified from charts and/or previously published scientific papers. Although these sites are "known," none on our expedition have been fully mapped and every new pass with our onboard sonar yields a new view (Figure 1).
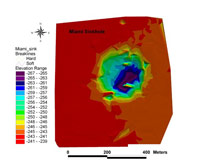
Figure 2: A bird's eye view of Miami Sinkhole, produced from fathometer soundings conducted prior to deployment of the submersible. This map was produced from 950 individual data points and gaps between these points were filled in, or interpreted, with GIS software. Click image for larger view and image credit.
In addition to those "known" sites, we conduct a broad-scale search for new locations as we are in-transit. Some days, science crew members have been taking 2-hour shifts to record "fixes" of fathometer data every 15 minutes, as well as to watch the fathometer read-out for any sudden changes which would indicate "bumps" or "holes" on the bottom (fathometer profile example). These fathometer surveys are conducted using single-beam echosounder sonar. Echo-sounder technology provides continuous lines of points with wide gaps between the lines, allowing crude maps of the seafloor to be produced (Figures 2 and 3).
Discovery of promising deep sea coral sites may ultimately lead to high-resolution multibeam sonar surveys in order to fully characterize the seafloor at these locations. Multibeam sonar provides wide "swaths" of closely spaced data points and complete coverage of the chosen area, much like mowing the lawn.
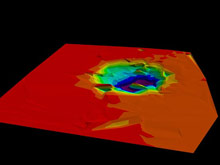
Figure 3: 3-D oblique view of Figure 2, looking north-northwest. Vertical features have been exaggerated 4 times their actual height to make them more conspicuous. Click image for larger view and image credit.
As we piece together seafloor topography (also often called bathymetry) information, geospatial scientists will study the overall distribution of hard bottom in the deep sea landscape. Patterns identified from this ongoing analysis can identify geological and oceanographic processes which will further advance our knowledge of this as-yet-little-known region of our world.
Sign up for the Ocean Explorer E-mail Update List.