

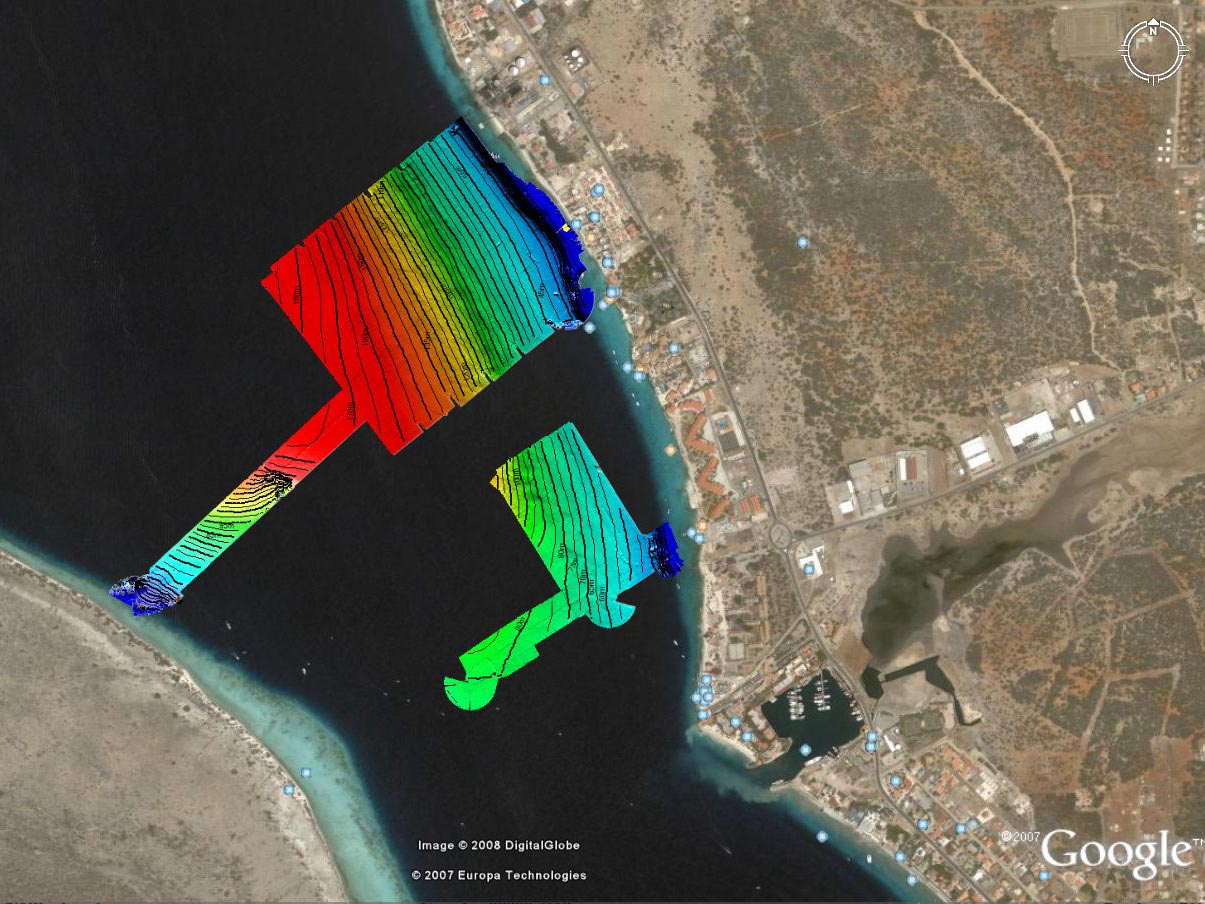
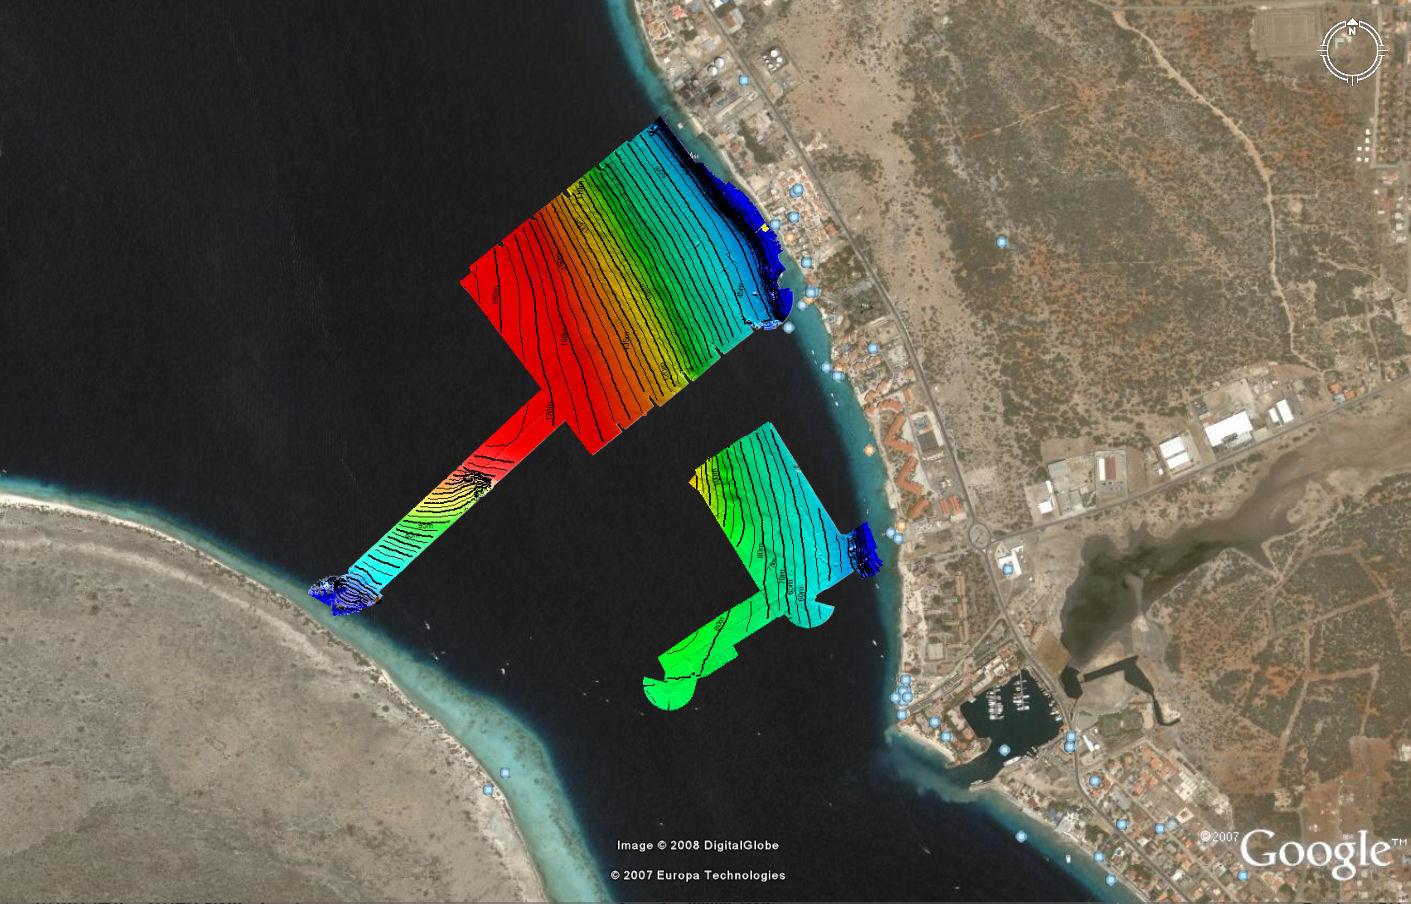
Bathymetric charts overlaid on top of a satellite photo of the island. Each rectangular shaped patch represents a single survey mission lasting between 1 and 2 hours of robot swim time. Colors indicate depths from shallow (dark blue) to depths of 170 to 180 m (558 to 590 ft) below the surface (red). The thick and thin black lines represent isobath contours (lines connecting similar depths). Charts like this help to identify target areas for deep trimix diving (a type of technical diving) and will help the marine park managers inventory the shallow and deep reef areas of Bonaire.
Bonaire 2008: Exploring Coral Reef Sustainability with New Technologies: Jan 16 Log
Download high-resolution image (jpg, 1 Mb)