


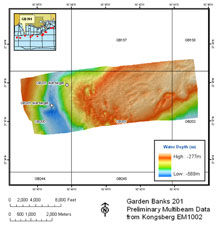
Multibeam bathmetry data for site GB201 acquired during the Lophelia II cruise. Click image for larger view and image credit.
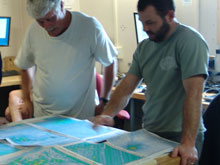
Chief scientist Erik Cordes (right) and geophysicist Bill Shedd review a bathymetric map while discussing what sites to explore next. Click image for larger view and image credit.
A Soft-bottom Survey
September 23, 2008
William (Bill) Shedd
Geophysicist
Minerals Management Service
Today we explored site GB201, a large (~ 6.5 kilometer (km) by 5.5 km, 250 meters (m) high) sea-floor structure supported by a shallow feature called a salt diapir. After examining a 3-D seismic map of the sea floor, the northwestern flank and several discreet areas on and near the crest of the site that appeared to be hardground, and, thus, showed the most promise for coral habitat and were chosen for today’s dive.
One characteristic of the site is the abundance of “pockmarks,” circular depressions on the sea floor that are hypothesized to be strong flows of gas that excavate sediment from the area, as opposed to mud volcanoes and flows that add new sediments. Our hypothesis was that the sediments being ejected from areas near the pockmarks might inhibit the development of healthy communities of filter feeders such as corals, while areas away from pockmarks may support corals.
We launched the remotely operated vehicle (ROV) early in the morning and it reached the bottom at 520 m approximately 15 minutes after launch. The area consisted of soft bottom with occasional colonial soft coral or hydroid colonies. The ROV proceeded east, up-slope towards the primary target. The entire transit was over soft bottom, with partially consolidated sediments and thin carbonates and occasional boulders at the local topographic high.
Eventually, the ROV encountered bacterial mats and methane bubbling from the sea floor. Immediately adjacent to this were some tubeworms and anemones covering an unidentified structure. The ROV then turned its course and ran over an area of thin, friable carbonate pavement covered by a layer of mud and occasional sponge and zoanthid anemone aggregations.
During this entire transit, we saw very few epifaunal (bottom-dwelling) organisms and occasional pockmarks of varying sizes. In the area of the lowest seismic return, we did encounter a large field of pockmarks on the sea floor. This is near to the area of high, large-scale pockmarks observed on the multibeam bathymetry at 315 m depth. We hypothesized that the high frequency of blow-out events creating the pockmarks could generate additional sediment input to the entire area, potentially sufficient to prevent coral growth.
The ROV continued to climb, heading to the local peak of the mound, reaching approximately 300 m depth. There were more pockmarks in this area, despite our hopes that there would be exposed carbonate rock from the bright reflectivity apparent from the seismic data. The only biological features at the top of the mound were sea whips and one isolated gorgonian colony with two basket stars on the sediment next to them. We saw no other apparent communities or exposed hardgrounds at the top of the mound, so the ROV proceeded south down into one of the large pockmarks visible on the multibeam data. The steep slope of the pockmark showed no exposed hardground and few organisms other than fish and occasional sea whips.
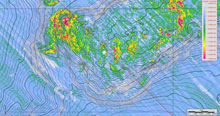
Bathymetric map with sea-floor amplitude underlay of the investigative site. The red, yellow, and green colors indicate the areas we expected to find carbonate rocks formed by bacteria that is suitable for corals to live on. Click image for larger view and image credit.
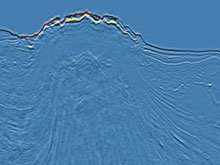
Three-dimensional seismic data were used to examine the sea floor. These data, created for the oil and gas industry to prospect for hydrocarbon in deep reservoirs, is acquired by sending sound waves from a ship down to the sea floor and deeper; these sound waves bounce off different layers below the Earth’s surface and back to long cables with sensors pulled behind the ship. Massive computers process the data and create pictures of the sea floor and the inside of the Earth. This vertical seismic profile shows the shallow part of the Earth below the site investigated. Click image for more information, larger image and credits.
In conclusion, this site was not a very lush coral community, probably because of the sediment being “excavated” by the gas expulsion onto the surrounding seafloor inhibited coral development. Corals are filter feeders (they eat tiny organisms from the seawater called plankton), and need clean water surrounding them. The sediment expelled from these pockmarks clogged their systems and covered the rocks they need to live on. They were observed in areas away from the pockmarks where the rocks and water were clean enough for healthy development.
Sign up for the Ocean Explorer E-mail Update List.