


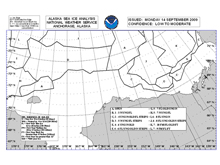
NOAA ice maps, updated every few days, are the best source for current and projected ice locations. Click image for larger view and image credit.
Where's the Ice?
September 14, 2009
Christine Patrick
Public Affairs Specialist
NOAA's Office of Ocean Exploration and Research
My obsession with the location of ice in the Chukchi Sea and East Siberian Sea is only about five days old, making me a latecomer compared to many of my shipmates, who have been scrutinizing ice maps for years. The sampling stations for the RUSALCA expeditions have been planned and precisely pinpointed in advance, but which ones we actually get to is another question entirely — all because of the ice.
In this region of the world, September is usually the ice-minimum (the time of year when ice extent is the smallest), which is why we are here now. However, it is impossible to predict with certainty exactly when the ice-minimum will be, and, more importantly for our expedition, where the ice will be. “The wind is everything to the ice up here,” said Chief Scientist Terry Whitledge at our first science meeting last week.
NOAA ice maps, updated every few days, are the best source for current and projected ice locations. The ice is divided into what looks like puzzle pieces on the map, showing areas that differ in ice thickness, age, and coverage. After reviewing yesterday’s map, we realized that the northernmost stations were beyond our grasp, locked up in ice covering 70% of the surface.
So, we decided to continue doing the stations near Wrangell Island, and head north along a line of stations in the East Siberian Sea, until we reached the ice edge. Meanwhile, many are hoping for a wind to blow from the south, which could push the ice north of our most northern stations, allowing us access.
The second-best scenario would be that the floating ice around those stations is relatively new and thin, meaning we could potentially navigate through it. Thick ice is out of the question, though: the Russian vessel Professor Khromov is an ice-strengthened ship, which can withstand some contact with sea ice, but it is not an icebreaker. And once within the ice floes, a wind from the south would become exactly what we wouldn’t want; it could cause the floes to jam together, possibly trapping the ship.
Around dinnertime last night, as we savored our ginger ice cream, we started wondering how far we were from the ice edge. Marine mammal expert Sue Moore headed to the bridge to compare our location to the ice projection map. “We’re nine miles into the ice now,” she said with a laugh, gesturing to the open water surrounding us in every direction.
It is happy news for the science crew aiming for those northern stations that we still haven’t seen the ice, and many of them are not surprised. The NOAA ice maps were not satellite images of what is, but projections of what will be, based on models— much like a local weather forecast. Even though these models are tested and improved upon continuously with available updates, they are nowhere near perfect. Scientists on the RUSALCA expedition, who themselves work with models — of ocean currents, plankton blooms, fish populations, and so much more — know this better than anyone.