

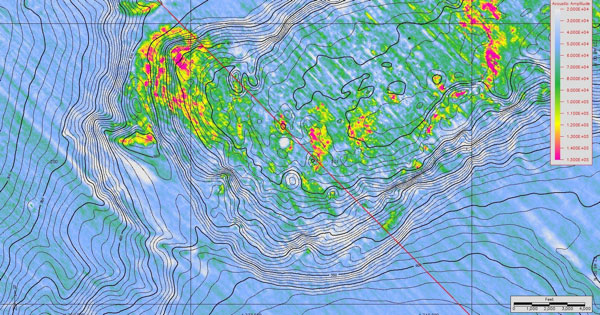
Researchers used this mplitude map with bathymetry (water depth) overlay, to pick sites for this project. The cooler colors (shown as blues and light greens) represent soft bottom muds, whereas the warmer colors (yellow, orange, and red) represent harder substrates, such as authigenic carbonates. The latter are our target areas. Note: This image was used on last year’s first reconnaissance cruise, Sept 2008. Map generated by the Minerals Management Service from 3-D seismic data courtesy of CGGVeritas, Inc. Image courtesy of CGGVeritas, Lophelia II 2009: Deepwater Coral Expedition – Reefs, Rigs and Wrecks.