


The Gigabytes of Data Come Streaming In!
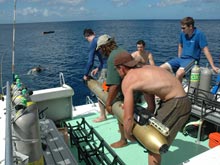
It takes a team of scientists (Bernard, Erwin, Alex) to launch the autonomous underwater vehicle (AUV) Gavia from the boat at the Nukove site. We are using both Gavia AUVs to survey the reefs here. Click image for larger view and image credit.
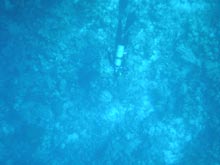
Scuba divers are conducting video and photo surveys of the sea floor. In this image, Dale is swimming down to a depth of 40 meters (131 feet) to conduct a photo transect survey at Nukove. Click image for larger view and image credit.
January 16, 2008
Arthur Trembanis
Expedition Co-principal Investigator
Assistant Professor, University of Delaware
AUV Operations and Marine Geologist
![]() A Gavia autonomous underwater vehicle (AUV) collects underwater imagery and water quality data at Nukcove. (Quicktime, 1.1 Mb.)
A Gavia autonomous underwater vehicle (AUV) collects underwater imagery and water quality data at Nukcove. (Quicktime, 1.1 Mb.)
![]() Scuba divers perform video and photo transect surveys of the sea floor at Nukove. (Quicktime, 1.1 Mb.)
Scuba divers perform video and photo transect surveys of the sea floor at Nukove. (Quicktime, 1.1 Mb.)
There is a lot to report from the last few days, and I cannot begin to encapsulate it all in a brief entry such as this. So I will try instead to provide a few highlights. Both the science and student teams have hit full stride and each day finds groups within our program exploring numerous outposts around the island of Bonaire. The undergraduate students are immersed in their independent study projects and coursework, and yet most find the time and energy to come and assist the science team operations.
The assistance of the students is invaluable, and we find that having such eager and capable volunteers at hand is a tremendous help. The students themselves benefit from the opportunity to participate in cutting-edge research and to gain unequaled access to technology not available in many other places — and certainly not in the concentrations we have at hand here in Bonaire.
Dale Stokes and Jim Leichter have been logging many, many hours deep underwater conducting their photo transects. Meanwhile, Noelle Relles — assisted by Hilary Stevens, Kat McCole, and Chris Coccaro — has been conducting camera surveys over the shallow reef tracts.
The robots and their operators have been working at a fierce but exciting pace. A key sensor system we have been using is the swath bathymetry sonar on the Gavia vehicle. This sensor allows us to map the sea floor using sound waves and resolve the complex topography of the bottom as if we had drained all of the water out of the sea and scanned the seabed with a laser beam. Each section of the seabed received a dense sampling of the topography, sometimes as many as 200+ soundings per square meter of the bottom. Examples of the kind of data density can be seen in the point cloud image (shown here).
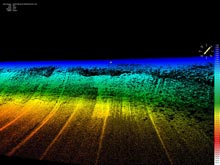
The bathymetric sonar onboard the Gavia autonomous underwater vehicle (AUV) provides an incredibly dense map of the reef structure. Each colored dot represents a sonar depth measurement with the colors indicating depth. (Dark blues are shallow — less than 5 meter (m), and yellows are depths around 35 m. Black areas are shadow zones where the reef drops off steeply.) You can see the overhanging coral on the crest of the reef and the steep sheer face, which is why this dive site is called “Cliffs.” Each AUV mapping survey generates millions of bathymetric soundings. Click image for larger view and image credit.
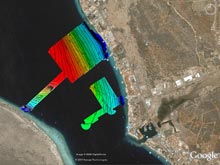
Bathymetric charts overlaid on top of a satellite photo of the island. Each rectangular shaped patch represents a single survey mission lasting between 1 and 2 hours of robot swim time. Colors indicate depths from shallow (dark blue) to depths of 170 to 180 m (558 to 590 ft) below the surface (red). The thick and thin black lines represent isobath contours (lines connecting similar depths). Charts like this help to identify target areas for deep trimix diving (a type of technical diving) and will help the marine park managers inventory the shallow and deep reef areas of Bonaire. Click image for larger view and image credit.
We can then bring these images into a geospatial context by portraying them in a geographical mapping system and viewing the data from a point in space high above the coastline. The alternately thick and thin black lines across the shaded color image indicate bathymetric contours. Cool colors, such as the dark blue, mark shallow depths near the coast and over the upper reef in depths, less than 20 m (65 ft). Warmer colors like the oranges and reds indicate deeper areas further from the shore where divers seldom or ever go and where the composition of the seabed and the extent of coral cover is unknown. These depths go down to 200 m (656 ft) in some places!
All of these images are very recent and very, very raw. They will require many hours to weeks of continued analysis and processing to filter out the bad data points and retain only the good ones. By overlaying the bathymetric charts on top of a satellite photo of the island, the science team is able to rapidly identify where we have completed our survey work and where we have gaps to fill in with additional AUV surveys — now and in future campaigns. The scientists’ job is not finished when the fieldwork ends and the data is collected, rather it only begins but the analysis and continued discovery is what makes it all so exciting.
Sign up for the Ocean Explorer E-mail Update List.