


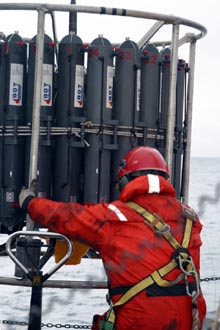
Attached to the ship via safety tether, Dave Huntley, of the University of Deleware, guides the CTD rosette as it descends into the sea. (Photo by Ian MacDonald, Texas A&M University.) Click image for larger view.
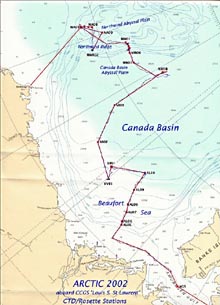
This map depicts the Louis’ track during the 4-wk expedition as well as the location of the 44 CTD casts performed along the way. (Image by Bon Van Hardenberg, Institute for Ocean Sciences Canada.) Click image for larger view.
Highlights of Measuring the Physical Properties of the Deep Canada Basin
August 14 - September 8, 2002
Dr. Mary-Louise Timmermans
Institute of Ocean Sciences & University of Victoria
A goal of the Institute of Ocean Sciences/University of Victoria oceanographers was to further explore the physical properties of the seawater in the Canada Basin at depths below that of the Alpha-Mendeleyev Ridge (about 2,400 m). The Alpha-Mendeleyev Ridge acts as a barrier between the Canada Basin and the adjacent Makarov Basin. Previous measurements made in the deep Canada Basin were relatively sparse. A goal of the 2002 Arctic Exploration was to obtain comprehensive deep salinity and temperature measurements on a basinwide scale to better determine how the geothermal heat from the ocean floor is escaping, and to where.
During the expedition, we lowered a SeaBird 911 conductivity, temperature and depth (CTD) sensor over the starboard deck of the Louis S. St. Laurent a total of 44 times to obtain 44 separate profiles of salinity and temperature (and, therefore, density) of the water column in the Canada Basin. Our lowering winch had approximately 3,400 m of cable, allowing measurements in the very deepest water of the Canada Basin. Real-time measurements were transmitted up the cable to our computer on the deck of the ship.
For each deep profile, which we call a cast, it took about 3 hrs to bring the CTD to just a few m above the sea floor and back. We obtained a total of 10 profiles deeper than 2,400 m, representing more deep casts than the total made from Canadian ice breakers over the past decade. This year, we obtained exceptionally detailed and accurate data using a high-resolution CTD equipped with two temperature probes and two conductivity cells.
The very deepest water is isolated from the rest of the Canada Basin and has likely been there for about 500 yrs. Hence, it is possible to detect the effects of geothermal heating from the sea floor. The bottom layer of water, which has a thickness of up to 1,000 m, is completely mixed, likely by convection from this heating. Small changes in temperature of this well-mixed layer will tell us, for example, how long this heating has been taking place (i.e., how long the water has been there), and whether the geothermal heat is remaining in the deep layer or escaping through the top. Our preliminary temperature measurements over the past decade indicate that most of the heat input is indeed escaping.
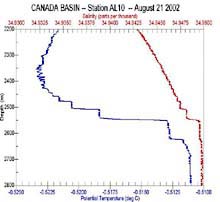
Salinity and potential temperature profile using data collected by the CTD at Station A10. (Image by Mary-Louise Timmermans, Institute for Ocean Sciences Canada.) Click image for larger view.
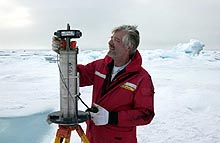
Standing on an ice floe, Doug Sieberg, of the Institute for Ocean Sciences Canada, calibrates an instrument in preparation for a later mooring deployment. (Photo by Emory Kristof, National Geographic Society.) Click image for larger view.
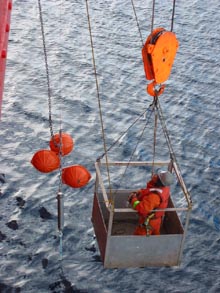
In preparation for mooring deployment, a crew member hangs from the starboard side of the ship to inspect the instrumentation and buoy setup. Click image for larger view.
Above the bottom layer, casts from previous Arctic expeditions indicate a striking “staircase” structure (about 300 m thick) in which there are well-mixed layers of water, or steps. Each step is about 40 m thick and differs by only a few millidegrees in temperature from the next. We know from past laboratory and theoretical studies that this staircase structure probably results from vertical heat transport in seawater in a process called double-diffusive convection. See the example (right) showing the unique step-like structure that was observed in all deep casts this year.
The persistence of the staircase over more than a decade, and its coherence for more than 1,000 km across the Canada Basin, not only indicate geothermal heating, but also suggest that little motion occurs at these depths. An interesting feature of the basin is that the well-formed staircase structure is not observed near the edges of the deep basin. Our calculations from five basin boundary casts this year suggest that there is indeed increased mixing there, although until now, we had insufficient data to confirm this, or to be precise about the amount of mixing. Additionally, a series of casts moving off the continental slope and into the deep basin show the transition to a well-formed staircase -- a clear sign that there is more mixing, and likely more vertical transport, of heat at the boundaries.
In addition to the CTD casts, at station AL10 we have anchored a vertical line of temperature recorders (a string of thermistors and temperature loggers), which will remain in placed for 2 yrs. These very accurate instruments give continuous readings of temperature in the bottom and staircase layers, complementing our CTD casts. This should indicate which step layers can be monitored, over what time period they maintain their identity, and what temperature variations are evident within the layers.
Future theoretical modeling of our observations will help us determine whether the structures that we observe are likely to change significantly in the near future, and could reveal the remarkable physical processes that are occurring at these depths. These questions will further our understanding of the role of deep water, and its relationship to the shallow and intermediate depth waters of the Arctic Ocean, which plays a vital part in the global ocean and climate system
For more information regarding the Canadian Physical Oceanography Group, see the August 21 Log.
Sign up for the Ocean Explorer E-mail Update List.