

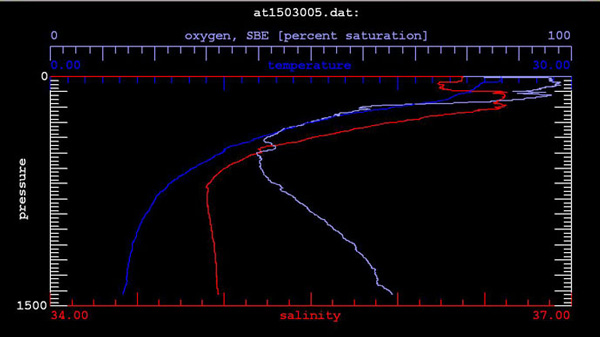
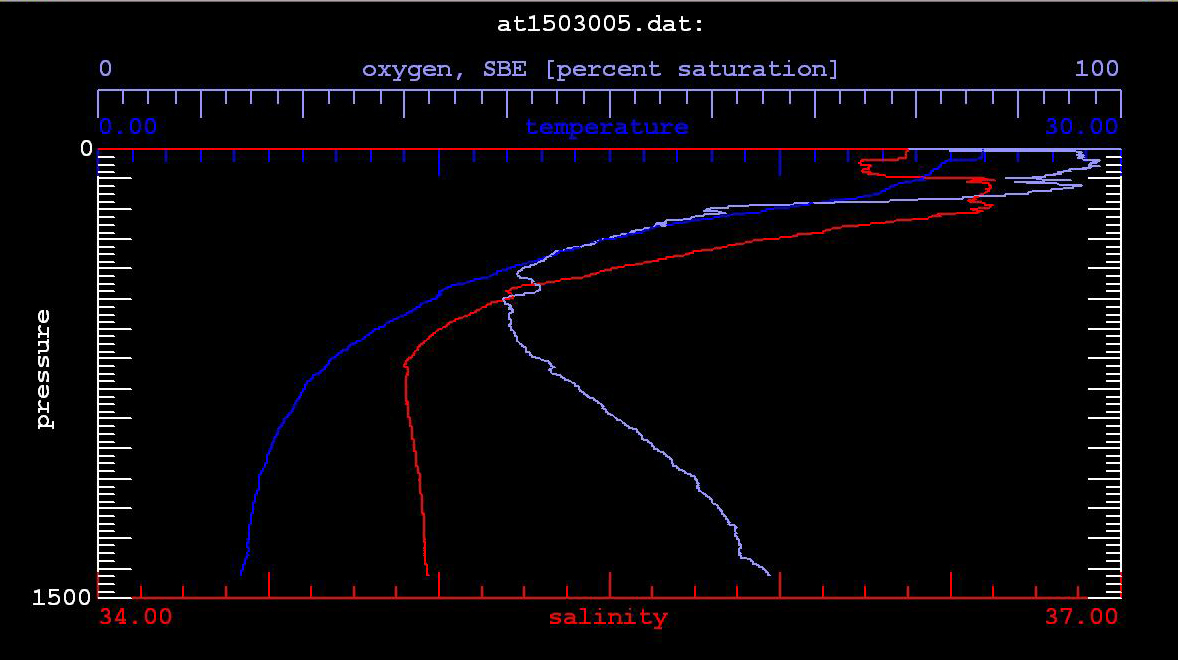
Fig. 3. Profiles of temperature (shown as dark blue), salinity (red) and dissolved oxygen (light blue) collected from the Atwater Valley study site. Temperature decreases rapidly with depth as does salinity (though not as much). Dissolved oxygen concentrations show a strong mid-water minimum but increase towards the bottom of the profile. Image courtesy of Expedition to the Deep Slope.