


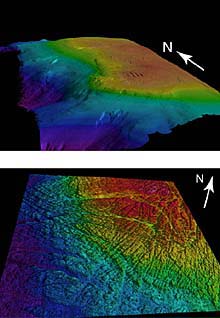
3-D maps of Heceta Bank made from multibeam sonar data collected in 1998. Click image for larger view.
Sea Floor Mapping
Bob Embley, Geophysicist
NOAA, Pacific Marine Environmental Laboratory
The first primitive maps of the sea floor came from “soundings” which involved lowering weighted lines into the water and noting when the tension on the line slackened. The depth was then measured by the amount of line that had payed out. These early maps gave only the most general picture of the ocean floor and only the larger features could be identified by looking for patterns of many such soundings. Most of these surveys were conducted to identify near-shore hazards to shipping. Only in the late 19th century did expeditions begin to take large numbers of soundings in deep water.
Using Sonar
The first modern breakthrough in sea floor mapping came with the use of underwater sound projectors, called “sonar”, which was first used in World War I. By the 1920s, the Coast and Geodetic Survey (an ancestor of the National Oceanic and Atmospheric Administration’s National Ocean Service) was using sonar to map deep water. The team of A. C. Veatch and P. A. Smith produced one of the first detailed maps of the ocean floor. This map showed that the canyons off the U.S. East Coast extended into very deep water. During World War II, advances in sonar and electronics led to improved systems that provided precisely timed measurements of the sea floor in great water depths. These systems provided the data with which scientists constructed the first real maps of important features such as deep-sea trenches and mid-ocean ridges, and led to the discovery of many new sea floor features of smaller scales. The publication of Heezen and Tharp’s Physiographic Map of the North Atlantic in 1957 was the first map of the sea floor that enabled the general public to begin to visualize what the ocean floor really looked like. These early maps, based on hundreds of thousands of hand-picked depths, provided the context for the plate tectonics revolution of the 1960s, which finally provided scientific explanations for the formation of mid-ocean ridges, trenches, and the “ring of fire” around the Pacific.
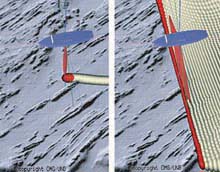
Comparing single (left) and multibeam (right) echo sounding of the seafloor. The multibeam method is preferred since it measures an entire area rather than a single line of seafloor. Click image for larger view.
Multibeam Technology
Still, these systems only produced depth soundings immediately below the ship’s tracks. To produce maps of the shape of the sea floor, one had to laboriously “contour” an area by connecting lines of equal depth together. Although the advent of digital computers in the 1960s provided much needed automation to the plotting of such data, the same basic technology was still being used by the civilian scientific community until the 1970s. In the 1960s, the U. S. Navy began using a new technology called “multibeam sonar.” Arrays of sonar projectors produced soundings not only along the track, but also for significant distances perpendicular to the ship’s track. Instead of lines of soundings, these new “multibeam” systems produced a “swath” of soundings. Combined with automated contouring, multibeam systems produced the ability to make detailed, complete maps of large areas of the sea floor, which became available to the scientific community for the first time in the late 1970s, after the Navy declassified the technology. Since these first multibeam systems, this technology has steadily improved and modern systems can map swaths up to several times the water depth. Combined with positional information provided by the GPS navigation systems now in common use, these systems provide a whole new view of the sea floor.
This is a critical part of our knowledge of the ocean. It is also important to map changes in the composition of the sea floor. Whereas depth can be measured using the timing of the signals going to and from the sea floor, a precise measurement of the “strength” of the sonar return is required to discern texture. For example, a sound pulse impinging on a mud sea floor will be absorbed for the most part with only a small percentage returning to the receiver, whereas a rock bottom will absorb very little sound and return most of it. In this way, modern sea floor survey systems measure relative strength of return signals as well as the depth.
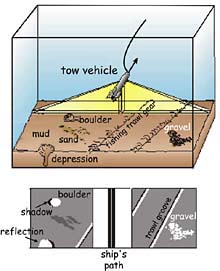
Schematic diagram of a sidescan sonar towed instrument insonifying the seafloor (top) and the sidescan data record created (bottom). Click image for a larger view and more detailed explanation. (U.S. Geological Survey)
Sidescan Sonar
In deeper water, a deeptow “sidescan sonar” system provides the best view of sea floor texture. These systems are towed on long cables and send and receive sound signals over a broad swath of sea floor. The resulting data consists of a pattern of signal returns of variable strength which provide a picture of the sea floor’s composition. Depending on the “pitch” of the system (low-pitch sound travels farthest), this type of survey can cover a swath up to several hundred kilometers wide.
For the Astoria survey in early June, the team will use a multibeam system mounted on the vessel Auriga and a deeptow sidescan system towed behind the vessel on a long electrically conducting cable. The deeptow system, provided by Search, Survey and Recover of Florida, will be towed at a speed of several knots some 200 to 300 m above the sea floor. At the same time, the multibeam system mounted on the ship will record detailed depth data at the same time. This will produce a map of the canyon that is detailed enough that will enable the team to choose the most interesting targets to investigate with the ROV (remotely operated vehicle).
Even the most detailed maps of the sea floor cannot answer the tantalizing question of “what does the sea floor really look like”? Over land areas, one can take detailed photographs from airplanes and spacecraft and actually walk around at sites of interest. In the ocean, light only penetrates about 100 m, and it is difficult, with current technology, to take useable sea floor photographs from depths greater than about 10 m (33 ft).
Sign up for the Ocean Explorer E-mail Update List.