


This illustration shows the global pattern of carbon degassing. Units are millions of tons of carbon/year. The discharge of carbon dioxide (CO2) from submarine volcanoes remains unmeasured. Click image for larger view and more details.
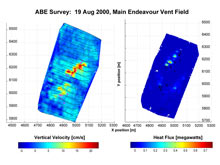
An example of a detailed near-bottom autonomous benthic explorer (ABE) survey. At the Endeavour Segment of the Juan de Fuca Ridge, ABE detected increases in water temperature over several known vent sites (right), and variations in the vertical velocity of vent discharge at the same locations (left). From these measurements, the amount of heat emitted by the vent field can be calculated. We plan to make similar measurements for CO2 at Brothers Volcano. Click image for larger view and more details.
Hidden CO2 Sources in the Ocean
Edward T. Baker
Supervisory Oceanographer
NOAA Vents Program, PMEL – Seattle, Washington
Joe Resing
Chemical Oceanographer
JISAO, University of Washington
NOAA Vents Program, PMEL
The accumulation of carbon dioxide (CO2) in Earth’s atmosphere and ocean is steadily increasing, raising concerns about global climate change and the increasing acidity of the ocean. While this increase is overwhelmingly caused by human activities — such as the use of fossil fuels — understanding how the Earth will react to this increase requires a solid understanding of all sources of CO2, human and natural. Over the long history of the Earth, changes in the supply of CO2 and other gases from volcanic eruptions have strongly contributed to the geochemical carbon cycle and the evolution of our atmosphere.
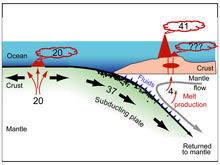
An important first step in quantifying the geochemical role of volcanic CO2 is to calculate the sources and sinks of geological CO2. In 1996, Yuji Sano and Stanley Williams summarized our present knowledge (shown in the illustration above). Their work found that the creation of new ocean crust by sea-floor spreading at mid-ocean ridges transfers about 20 million tons/year of carbon (in the form of CO2) from the mantle to the deep ocean, primarily by the release of gas from lava eruptions on the sea floor. Where oceanic plates are consumed, and one plate is subducted underneath another, deep trenches and volcanic arcs are formed. This process has created the Kermadec Trench and the Kermadec Arc, including Brothers Volcano.
As the oceanic plates move from the mid-ocean spreading ridges to the arcs, they cross the ocean basins gathering sediments rich in carbonates and organic carbon. As the plates descend, they carry this carbon back into the mantle, at the rate of about 37 million tons/year. Heating of the sinking plates fluidizes this carbon, and it begins to percolate back to the Earth’s surface. This carbon, plus an additional 4 million tons/year from the mantle itself, is thought to escape the subduction zone via volcanic eruptions. Until recently, this carbon was believed to escape from subaerial arc volcanoes (those located above sea level). At any one time, approximately 50 subaerial volcanoes are active worldwide.
However, exploration over the last 10 years, including the several Submarine Ring of Fire expeditions, have found that at least 50, and perhaps 100 or more, submarine arc volcanoes are also discharging volcanic fluids and gases rich in CO2. Thus some of the 41 million tons/year of carbon thought to be released into the atmosphere must instead be captured by submarine volcanoes and injected into the ocean. Determining the amount of volcanic CO2 added to the ocean from this source is an important scientific objective.
Measuring the discharge rate of CO2 from even a single submarine volcano has not yet been accomplished. This year’s Submarine Ring of Fire expedition plans to attack that problem directly. The ABE autonomous underwater vehicle (AUV) will map the entire Brothers Volcano in detail. It will also conduct detailed surveys over selected vent fields to make near-bottom high-resolution maps of water temperature, pH, and hydrothermal discharge. Areas where the pH decreases are those where volcanic gasses rich in CO2 and SO2 (sulfur dioxide) are escaping from the volcano. Samples from these areas will be collected using conductivity, temperature, depth (CTD) hydrocasts and from the remotely operated vehicle (ROV), if possible, using special gas tight bottles. From these samples we will be able to calculate how much of the decrease in pH comes from CO2, which will then allow us to calculate the discharge rate of CO2 from the volcano.