


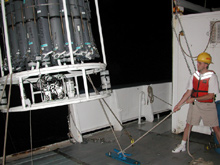
Just before midnight, Fred Andrus helps to lower the 2,400-lb CTD over the ship’s starboard side. Click image for larger view.
Ocean Weather
August 9, 2003
Rich Styles
Department of Geological Sciences
University of South Carolina
My mission on this voyage is to collect gigabytes of current, temperature and salinity (salt content of the ocean) data. Everywhere the ship travels, we deploy our instruments. The composite data taken from these sites are updated almost instantly, and my colleague, Dara Hooker, and I use our onboard computers to generate “maps” of ocean weather.
What do we mean by ocean weather? Well, it's similar to the weather information you get on TV, but with a slightly different focus. Where a meteorologist might discuss wind gusts and how it impacts human activities, we are interested in the current speed and direction near the bottom and how it affects benthic organisms. The flow of nutrient-carrying waters is a source of food, and, therefore, critical to survival. Meteorologists are also interested in frontal zones, regions where two air masses with different properties (e.g., temperature, moisture content) come into contact. Fronts signify the location of storms and rainy weather. In the ocean, we measure the temperature and salinity distribution to identify "frontal zones" of different water masses. These water masses possess varying levels of nutrients, gases, and other constituents important to ocean life. Fronts trap particles and food and, therefore, attract fish. Ask any sports or commercial fisherman and they will tell you that fronts mean good fishin’.
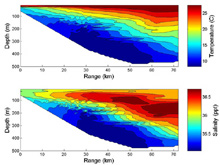
Temperature and salinity distributions from the edge of the continental shelf out to about the center of the Gulf Stream. Click image for larger view.
The figure at left denotes the temperature and salinity distributions from the edge of the continental shelf out to about the center of the Gulf Stream. The intersection of the colored and white regions denotes the bottom. The outer continental shelf is on the left, where the water depth is about 70 m. The maximum water depth occurs at about 55 km offshore. Water temperature decreases as a function of depth. Colder water is denser and sinks. Thus, we expect to see the coldest water at the bottom. Salty water is heavier, a fact you might notice when comparing how much higher your body floats in the ocean than in a swimming pool. In the Gulf Stream, the saltiest waters are below the surface between 100 and 200 m. The salinity is slightly lower near the bottom. If the salinity were taken alone, this would suggest that lighter water underlies heavier water. However, both temperature and salinity contribute to water density. The much greater change in temperature from top to bottom counteracts the weaker decrease in salinity near the bottom to produce a stable (i.e., heavier water on the bottom) water column.
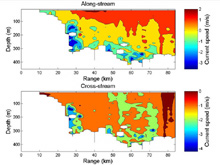
This figure denotes the current along a similar cross-stream transect as the temperature and salinity data depicted above. Click image for larger view.
The figure at right denotes the current along a similar cross-stream transect as the temperature and salinity data depicted above. Unlike the temperature and salinity data, the current flows with a certain speed in a specific direction. For the Gulf Stream, we break the current direction into two components: one flowing in the direction of the Gulf Stream and one flowing perpendicular or across the Gulf Stream. The upper panel depicts the along-stream flow. The along-stream currents are fastest near the surface, with values close to 2 meters per second. This is typical of the Gulf Stream, but very fast compared to the ocean as a whole. The lower panel denotes the across-stream flow. On average, the cross-stream flow is much weaker than the along-stream flow. This is not surprising considering that the along-stream coordinate is more or less oriented with the direction of the maximum current.