


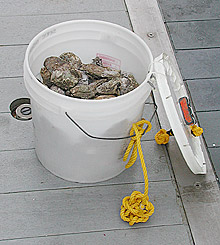
The carrion traps are baited with rotting oysters and left on the bottom overnight to attract mobile organisms. Click image for larger view.
One Man’s Flotsam is Another’s Jetsam
August 12, 2003
Elizabeth Wenner, PhD
South Carolina Department of Natural Resources
![]() Video of manipulator arm retrieving carrion bucket. (mp4, 2.6 MB)
Video of manipulator arm retrieving carrion bucket. (mp4, 2.6 MB)
“It is in the exploration of this vast deep-sea region that the finest field for submarine discovery yet remains.”
Edward Forbes, 1851
“The wrecks dissolve above us; their dust drops down from afar—
Down to the dark, to the utter dark where the blind white sea snakes are…”
Rudyard Kipling
Baited traps were first used in the 1870s during the oceanographic cruises of Prince Albert I of Monaco. A century later, in the mid-1970s, a baited trap in combination with a camera was deployed to document the creatures attracted to the bait at various depths.
What becomes apparent from viewing the photographs of the swarms of deep-sea organisms around baited traps is that nothing is wasted in the deep sea. Most of the organic matter that results naturally from the dead bodies of fishes, whales and other large organisms becomes an “all you can eat” buffet that creates a rich windfall.
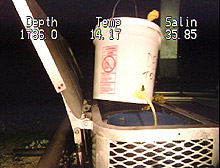
The first two carrion buckets were deployed with the Johnson-Sea-Link II submersible's manipulator arm. Click image for larger view.
In the early 1980s, I deployed carrion traps at depths of 194-212 m on ridge areas off the coast of South Carolina. The main organisms caught in these traps were crustaceans, most of which were necrophagous amphipods and isopods. I decided it would be worthwhile to repeat the experiment on this cruise at the deep depths under the Charleston Bump.
The buckets that we deployed from the submersible were filled with dead oysters that would not only provide food for the scavengers of the deep, but would also provide a complex substrate within which the organisms could hide. We added additional lead weights to the bottom of the buckets to keep them from floating away.
The deployment of the buckets was exciting. Dan Bogess, pilot of the submersible, used the claw to tug on the first baited bucket that was loaded in the front basket of the sub. At first, the bucket didn’t come out and appeared to be wedged in the basket. Dan expertly maneuvered the bucket until he managed to gently lift it from the basket and deposit it at the bottom of a rise. He then grabbed a floating line and carefully lifted the lid of the bucket to expose the rotting oysters. After getting a fix on the location where the bucket was deployed, he proceeded to move the submersible up a slope to the top of a rise where large slabs of manganese-phosphorite rock were strewn over the landscape. Dan repeated the process of removing the bucket and lid, leaving this bucket at the top of the rise amongst the rock slabs. It would be a waiting game until the buckets were retrieved the next day.
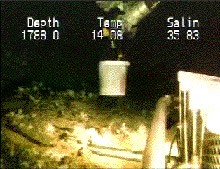
Carrion traps have been used for more than a century. The big question for this cruise was not about their deployment, but whether or not we could find them again and retrieve them. As you can tell by this video, we did. (mp4, 2.3 MB)
![]() Click image for video.
Click image for video.
I eagerly awaited the return of the sub the next morning. I woke up early after having worked all night on the “graveyard” watch that goes from midnight to 6 a.m. Of course, my first thoughts were that we should have put a pinger on the bucket to make relocation easier. Pingers emit a signal enabling the sub to home in easily. However, the competent crew on the bridge, who were tracking the movement of the sub far below, helped guide Dan toward the buckets. He located them easily. Rich Styles, who was riding in the sub sphere with Dan, noted that swarms of bright red shrimp circled the buckets. Retrieval went off without a hitch.
Once the sub was secured back aboard the R/V Seward Johnson, we took the carrion traps out of the front basket and carefully began to wash each oyster shell. Some of the shells were only partially gaping, so we opened them and washed out the rotting meat. A bright red caridean shrimp, tentatively identified as Plesionika sp., was in the bucket, as were hundreds of amphipods with bright orange eyes. These scavenging amphipods have mouthparts that are adapted to slicing, biting and chewing, making them well adapted as the “vultures” of the deep.
It isn’t known from what distance these scavengers are attracted to the baited buckets, but clearly, they must have highly developed sensory receptors. Perhaps they make use of the currents that occur near the bottom and move in the direction of the bait's odor trail until they locate the odiferous food. It has been suggested that these amphipods move like hovering buzzards above the sediment surface until they locate the chemical plume of the odor and follow it either upstream or downstream of the current. The energetic cost of hovering or swimming may be offset by the use of fat deposits in the organism that keep it near buoyancy.
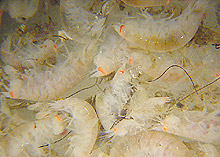
A mass of amphipods collected with the carrion trap. Click image for larger view.
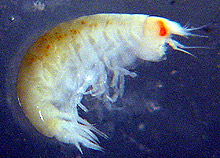
This particular type of amphipod was found in huge numbers in the first two carrion traps recovered. Click image for larger view.
Once again, we have combined some rather simple collection methods with the high-tech use of the submersible. It would have been impossible to strategically place and recover the traps without the sub. This experiment is appropriately best described as Occam’s Razor Meets Mr. Wizard!
This 3-D flythrough was created using bathymetric data collected by the NOAA Ship Whiting. Video courtesy of Phil Weinbach.
![]() Click image for video. (QuickTime, 716 Kb)
Click image for video. (QuickTime, 716 Kb)
GIS and the Charleston Bump
August 12, 2003
Phil Weinbach
GIS Manager
South Carolina Department of Natural Resources
![]() 3-D flythrough video. (QuickTime, 716 Kb)
3-D flythrough video. (QuickTime, 716 Kb)
A geographic information system (GIS) is a computer technology that organizes and manages geographic information (the location of things in space), and can quickly generate maps that can display different combinations of data. Scientists have only recently begun using GIS to better understand the location and relative distribution of information in the marine environment. Unlike the land, the sea is a highly dynamic and difficult-to-sample environment. On land, it may be easy to plot the location of a mountain, a tree or a forest, or even of the species that use them. For the most part, these features can easily be visited and surveyed, and there are numerous opportunities to observe and count the creatures found there.
In contrast, information from the marine environment is much more difficult to obtain. While much progress has been made in understanding the shape of the "land” beneath the sea, understanding what it is composed of, what grows there, and what uses it for food and shelter is challenging. Expeditions such as this one to the Charleston Bump are, in many ways, in the early stages of using GIS to help us visualize what things are really like beneath the cryptic surface of the ocean.
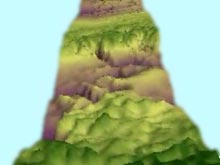
A 3-D representation of ocean topography off the southeast portion of the United States. Image courtesy of Phil Weinbach. Click image for larger view.
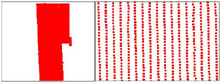
From far away, the Whiting data appears seamless. Zoom in and individual data points can be distinguished. Image courtesy of Phil Weinbach. Click image for larger view.
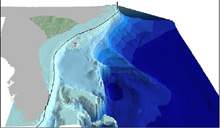
The NOAA Ship Whiting has provided us with several multibeam sonar surveys of the Charleston Bump region. With this information, we can use a GIS to develop detailed representations of the bathymetry (sea-floor topography) of an area. During a single multibeam survey, millions of individual data points are collected. Each record has a point location, corresponding to latitude (x-value) and longitude (y-value), as well as a corresponding depth (z-value). When all the x and y values are plotted in a GIS, the Whiting point data appears to be a solid, seamless data set. However, zoom in for a closer look and you can see each of the individual point data collected during the survey.
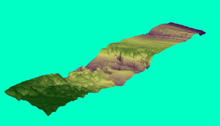
A topographic representation of the sea floor around the Charleston Bump. Click image for larger view.
The information saved in one record alone doesn’t tell us much. But plot the millions of individual point data (referred to as “mass points”) coupled with their z (depth) information, and a realistic three-dimensional portrayal of the sea floor emerges.
Bathymetric information alone can be used in a variety of applications; possible uses may include determining the placement of shipping channels, better understanding bottom topography and currents, and even identifying potential locations of fish aggregations. Imagine a large freighter, loaded with millions of dollars worth of goods, traveling blindly through narrow shipping passages toward a crowded harbor. With no information about the sea floor, disasters are more likely. A captain using with the latest navigation software and accurate bathymetry data can confidently and accurately navigate through narrow straights en route to the ship’s final port of call. That is just one example of the power of good bathymetry data and GIS technology.
The ability to view and manipulate bathymetric data alone makes GIS a valuable tool. However, that just scratches the surface of what GIS can do. Its true utility comes from its ability to overlay different "layers" of spatial information on top of each other.
For example, the sub crew’s engineer records sub track data using an IPS (integrated positioning system) during every dive. This "data layer" can be plotted over the bathymetric data to show the actual track line of the sub over the sea floor. These can then be compared to the actual video recorded from the sub to provide even greater information about sea-floor habitats. Animations or flyby videos can also be created in a GIS to give researchers an idea of what to expect on their sub dive.
The Charleston Bump GIS data have been very helpful in assessing our dive sites on this Ocean Explorer expedition. Based on interesting features such as areas of high relief or proximity to coral mounts, we began the cruise with 11 pre-planned dive sites. Of course, we can never know exactly what we’ll encounter once we plunge into the sea. Sometimes circumstances work to our advantage; we hit our target location, and collect valuable information. Other times, unpredictable currents, or a variety of other factors, can hamper the dive. (See the Aug 5, 2003 daily log.) Even though some dives aren’t successful (e.g., we encounter dangerous conditions and have to abort, or we miss our dive target), it is not a total waste of time and effort. Situations like this allow us to go back to the GIS, add any additional information we may have gathered, and use our newfound knowledge to better plan for remaining dives.
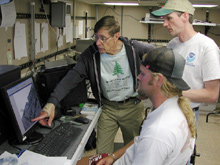
Chief scientist Charlie Barans (left), expedition coordinator John McDonough (right) and GIS manager Phil Weinbach (center foreground) review surfaces created from Whiting bathymetry data to determine target sites for upcoming dives. Click image for larger view.
When making any changes to proposed operations locations, whether for sub dives or any other scientific activities, it is important to quickly and accurately relay this information to the R/V Seward Johnson’s captain. This is crucial in the planning process, as it allows the bridge to calculate the time needed to arrive at a new site.
GIS has also helped us plan many of our surface operations during this expedition. Two-dimensional data have proven just as useful as three-dimensional plots of the ocean floor. Daily SST (sea surface temperature) maps are used to locate the gyres and oscillations in the Gulf Stream created by the Charleston Bump. These images can be analyzed to find ocean temperature gradients, which are very useful in locating fish assemblages. We use this information, in addition to plots of historical data of fish densities and catch locations, to make informed decisions as to where to concentrate our fishing efforts for the billfish satellite tagging program.
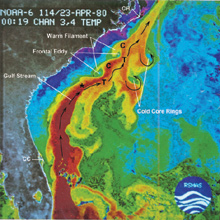
Sea surface temperature readings can be used to identify thermal fronts where fish often congregate. On this expedition, scientists are using GIS to identify these locations for the billfish satellite tagging program. Image courtesy South Carolina Dept. of Natural Resources. Click image for larger view.
There are, of course, countless other uses of GIS technology. This is the first year our group of researchers and scientists has had access to this level of GIS technology. We have all been impressed with the utility of GIS. Its ability to make on-the-fly calculations and provide us with informed decision-making tools has found its place on this and similar cruises. I am thrilled to have been given the opportunity to use my GIS skills on this cruise in a truly meaningful manner. I trust that GIS will continue to be an integral part of all future Ocean Explorer expeditions.